Observability for your Home Sever with Prometheus, Grafana and Loki
By the end of this post we’ll have the following insights into our server:
Create Admin User Credentials
We already created a sealed secret in the previous post, so let’s just get right into it:
kubectl -n observability create secret generic grafana-adminuser-creds \
  --from-literal=adminUser='changeme' \
  --from-literal=adminPassword='changeme' \ (1)
  --dry-run=client -o yaml \
  > grafana-adminuser-creds.yaml

kubeseal --format=yaml --cert=pub-sealed-secrets.pem \
  < grafana-adminuser-creds.yaml > grafana-adminuser-creds-sealed.yaml

rm grafana-adminuser-creds.yaml| 1 | You can create a random password with openssl rand -base64 30. |
Create the Flux Manifests
|
The source code is available on GitHub. |
Our Flux project currently looks like this:
.
├── clusters
│   └── production
│       ├── flux-system
│       │   ├── gotk-components.yaml
│       │   ├── gotk-sync.yaml
│       │   └── kustomization.yaml
│       └── infrastructure.yaml
└── infrastructure
    └── controllers
        ├── kustomization.yaml
        └── sealed-secrets.yaml

6 directories, 6 files
Let’s create a new directory, /infrastructure/observability and copy grafana-adminuser-creds-sealed.yaml there.
Create the following files also in the /infrastructure/observability directory:
namespace.yamlapiVersion: v1
kind: Namespace
metadata:
name: observabilitykube-prometheus-stack.yaml---
apiVersion: source.toolkit.fluxcd.io/v1
kind: HelmRepository
metadata:
name: prometheus-community-charts
namespace: observability
spec:
interval: 24h
url: https://prometheus-community.github.io/helm-charts
---
apiVersion: helm.toolkit.fluxcd.io/v2
kind: HelmRelease
metadata:
name: kube-prometheus-stack
namespace: observability
spec:
interval: 30m
chart:
spec:
chart: kube-prometheus-stack
version: "61.x"
sourceRef:
kind: HelmRepository
name: prometheus-community-charts
namespace: observability
interval: 12h
# https://github.com/grafana/helm-charts/blob/main/charts/grafana/values.yaml (1)
# https://github.com/prometheus-community/helm-charts/blob/main/charts/kube-prometheus-stack/values.yaml
values:
kubeControllerManager:
enabled: false (2)
kubeScheduler:
enabled: false
kubeProxy:
enabled: false
grafana:
service:
type: ClusterIP
admin:
existingSecret: grafana-adminuser-creds
userKey: adminUser
passwordKey: adminPassword
persistence: (3)
enabled: true
size: 1Gi
sidecar: (4)
dashboards:
enabled: true
searchNamespace: ALL
alerts:
enabled: true
searchNamespace: ALL| 1 | For reference, these YAML files contain all the values we can override. |
| 2 | We disable monitoring components which do not exist in MicroK8s. |
| 3 | Prometheus will build up a data store over time, which is useful for example to query a week’s worth of data. However without persistence, if the pod were to restart (for example when we update kube-prometheus-stack), the data would be lost and Prometheus would need to start again. |
| 4 | The kube-prometheus-stack has a feature where it searches for resources in the cluster matching certain labels. We will leverage this soon to create Grafana dashboards and alerts. |
loki-stack.yaml---
apiVersion: source.toolkit.fluxcd.io/v1
kind: HelmRepository
metadata:
name: grafana-charts
namespace: observability
spec:
interval: 24h
url: https://grafana.github.io/helm-charts
---
apiVersion: helm.toolkit.fluxcd.io/v2
kind: HelmRelease
metadata:
name: loki
namespace: observability
spec:
interval: 5m
dependsOn:
- name: kube-prometheus-stack
chart:
spec:
version: "5.x"
chart: loki
sourceRef:
kind: HelmRepository
name: grafana-charts
interval: 60m
# https://github.com/grafana/loki/blob/main/production/helm/loki/values.yaml
values:
loki:
auth_enabled: false
serviceMonitor:
enabled: true
labels:
app.kubernetes.io/part-of: kube-prometheus-stack
commonConfig:
replication_factor: 1
storage:
type: 'filesystem'
chunk_store_config:
max_look_back_period: 24h
compactor:
shared_store: filesystem
compaction_interval: 10m
delete_request_cancel_period: 10m
retention_enabled: true
retention_delete_delay: 2h
retention_delete_worker_count: 150
limits_config:
retention_period: 24h
gateway:
enabled: true
singleBinary:
replicas: 1
monitoring:
dashboards:
enabled: false
selfMonitoring:
enabled: false
grafanaAgent:
installOperator: false
lokiCanary:
enabled: false
test:
enabled: false
---
apiVersion: helm.toolkit.fluxcd.io/v2
kind: HelmRelease
metadata:
name: promtail
namespace: observability
spec:
interval: 5m
dependsOn:
- name: kube-prometheus-stack
chart:
spec:
version: "6.x"
chart: promtail
sourceRef:
kind: HelmRepository
name: grafana-charts
interval: 60m
# https://github.com/grafana/helm-charts/blob/main/charts/promtail/values.yaml
values:
test:
enabled: false
extraObjects:
- apiVersion: v1
kind: ConfigMap
metadata:
name: loki-datasource
labels:
app: loki
chart: loki
release: loki
grafana_datasource: "1"
app.kubernetes.io/part-of: kube-prometheus-stack
data:
loki-datasource.yaml: |-
apiVersion: 1
datasources:
- name: Loki
type: loki
access: proxy
url: http://loki:3100
version: 1
isDefault: falsekustomization.yamlapiVersion: kustomize.config.k8s.io/v1beta1
kind: Kustomization
resources:
- namespace.yaml
- grafana-adminuser-creds-sealed.yaml
- kube-prometheus-stack.yaml
- loki-stack.yamlFinally, let’s update /clusters/production/infrastructure.yaml, and add the following:
---
apiVersion: kustomize.toolkit.fluxcd.io/v1
kind: Kustomization
metadata:
  name: infra-observability
  namespace: flux-system
spec:
  dependsOn:
    - name: infra-controllers (1)
  interval: 10m0s
  sourceRef:
    kind: GitRepository
    name: flux-system
  path: ./infrastructure/observability
  prune: true
  wait: true
timeout: 10m0s| 1 | Ensures that the controllers are deployed first. We need this dependency because our observability stack makes use of sealed secrets (which are managed by the controllers). |
The resultant structure should look like this:
.
├── clusters
│   └── production
│       ├── flux-system
│       │   ├── gotk-components.yaml
│       │   ├── gotk-sync.yaml
│       │   └── kustomization.yaml
│       └── infrastructure.yaml (1)
└── infrastructure
    ├── controllers
    │   ├── kustomization.yaml
    │   └── sealed-secrets.yaml
    └── observability (2)
        ├── grafana-adminuser-creds-sealed.yaml
        ├── kube-prometheus-stack.yaml
        ├── kustomization.yaml
        ├── loki-stack.yaml
        └── namespace.yaml

7 directories, 11 files
Apply the Flux Manifests
Git commit, push, and voila! Within a few minutes the observability stack will be deployed:
flux get all -n observabilityNAME REVISION SUSPENDED READY MESSAGE
helmrepository/grafana-charts sha256:2b983de9 False True stored artifact: revision 'sha256:2b983de9'
helmrepository/prometheus-community-charts sha256:79c45301 False True stored artifact: revision 'sha256:79c45301'
NAME REVISION SUSPENDED READY MESSAGE
helmchart/observability-kube-prometheus-stack 61.9.0 False True pulled 'kube-prometheus-stack' chart with version '61.9.0'
helmchart/observability-loki 5.48.0 False True pulled 'loki' chart with version '5.48.0'
helmchart/observability-promtail 6.16.6 False True pulled 'promtail' chart with version '6.16.6'
NAME REVISION SUSPENDED READY MESSAGE
helmrelease/kube-prometheus-stack 61.9.0 False True Helm install succeeded for release observability/kube-prometheus-stack.v1 with chart kube-prometheus-stack@61.9.0
helmrelease/loki 5.48.0 False True Helm install succeeded for release observability/loki.v1 with chart loki@5.48.0
helmrelease/promtail 6.16.6 False True Helm install succeeded for release observability/promtail.v1 with chart promtail@6.16.6If we take a look at what’s inside Kubernetes, you’ll see there’s a lot going on!
kubectl get all -n observabilityNAME READY STATUS RESTARTS AGE
pod/alertmanager-kube-prometheus-stack-alertmanager-0 2/2 Running 0 4m16s
pod/kube-prometheus-stack-grafana-56d5b9c8d4-k4cp2 4/4 Running 0 4m17s
pod/kube-prometheus-stack-kube-state-metrics-5689dc5579-n8hj8 1/1 Running 0 4m17s
pod/kube-prometheus-stack-operator-844d4cdd76-2g492 1/1 Running 0 4m17s
pod/kube-prometheus-stack-prometheus-node-exporter-n8gmq 1/1 Running 0 4m17s
pod/loki-0 1/1 Running 0 3m40s
pod/loki-gateway-c4566d587-rwkxb 1/1 Running 0 3m40s
pod/prometheus-kube-prometheus-stack-prometheus-0 2/2 Running 0 4m16s
pod/promtail-rhln6 1/1 Running 0 3m42s
NAME TYPE CLUSTER-IP EXTERNAL-IP PORT(S) AGE
service/alertmanager-operated ClusterIP None <none> 9093/TCP,9094/TCP,9094/UDP 4m16s
service/kube-prometheus-stack-alertmanager ClusterIP 10.152.183.169 <none> 9093/TCP,8080/TCP 4m17s
service/kube-prometheus-stack-grafana ClusterIP 10.152.183.174 <none> 80/TCP 4m17s
service/kube-prometheus-stack-kube-state-metrics ClusterIP 10.152.183.99 <none> 8080/TCP 4m17s
service/kube-prometheus-stack-operator ClusterIP 10.152.183.41 <none> 443/TCP 4m17s
service/kube-prometheus-stack-prometheus ClusterIP 10.152.183.204 <none> 9090/TCP,8080/TCP 4m17s
service/kube-prometheus-stack-prometheus-node-exporter ClusterIP 10.152.183.134 <none> 9100/TCP 4m17s
service/loki ClusterIP 10.152.183.189 <none> 3100/TCP,9095/TCP 3m40s
service/loki-gateway ClusterIP 10.152.183.44 <none> 80/TCP 3m40s
service/loki-headless ClusterIP None <none> 3100/TCP 3m40s
service/loki-memberlist ClusterIP None <none> 7946/TCP 3m40s
service/prometheus-operated ClusterIP None <none> 9090/TCP 4m16s
NAME DESIRED CURRENT READY UP-TO-DATE AVAILABLE NODE SELECTOR AGE
daemonset.apps/kube-prometheus-stack-prometheus-node-exporter 1 1 1 1 1 kubernetes.io/os=linux 4m17s
daemonset.apps/promtail 1 1 1 1 1 <none> 3m42s
NAME READY UP-TO-DATE AVAILABLE AGE
deployment.apps/kube-prometheus-stack-grafana 1/1 1 1 4m17s
deployment.apps/kube-prometheus-stack-kube-state-metrics 1/1 1 1 4m17s
deployment.apps/kube-prometheus-stack-operator 1/1 1 1 4m17s
deployment.apps/loki-gateway 1/1 1 1 3m40s
NAME DESIRED CURRENT READY AGE
replicaset.apps/kube-prometheus-stack-grafana-56d5b9c8d4 1 1 1 4m17s
replicaset.apps/kube-prometheus-stack-kube-state-metrics-5689dc5579 1 1 1 4m17s
replicaset.apps/kube-prometheus-stack-operator-844d4cdd76 1 1 1 4m17s
replicaset.apps/loki-gateway-c4566d587 1 1 1 3m40s
NAME READY AGE
statefulset.apps/alertmanager-kube-prometheus-stack-alertmanager 1/1 4m16s
statefulset.apps/loki 1/1 3m40s
statefulset.apps/prometheus-kube-prometheus-stack-prometheus 1/1 4m16sExploring Grafana
If you’re not already familiar with Kubernetes, you can think of a Service as something which serves Pod(s). In our case there is only one Grafana pod, but in future there could be several, and the service could be load-balancing requests between them. Therefore to access Grafana, we need to make service/kube-prometheus-stack-grafana accessible.
Let’s port forward Grafana so we can connect from our local machine:
kubectl port-forward service/kube-prometheus-stack-grafana -n observability \
--address 0.0.0.0 8080:80 (1)| 1 | Grafana exposes the UI on port 80. Let’s map port 80 in the pod to port 8080 on the host. |

Open the following URL in your browser: http://<server-IP>:8080 and you’ll be greeted with Grafana’s login page:
If you’ve forgotten your Grafana admin user credentials (no judgement here), you can get them from within the cluster:
kubectl get secrets/grafana-adminuser-creds -n observability -o json \
  | jq -r '.data.adminUser' | base64 -d

kubectl get secrets/grafana-adminuser-creds -n observability -o json \
  | jq -r '.data.adminPassword' | base64 -d
Login and, tada! 🥁
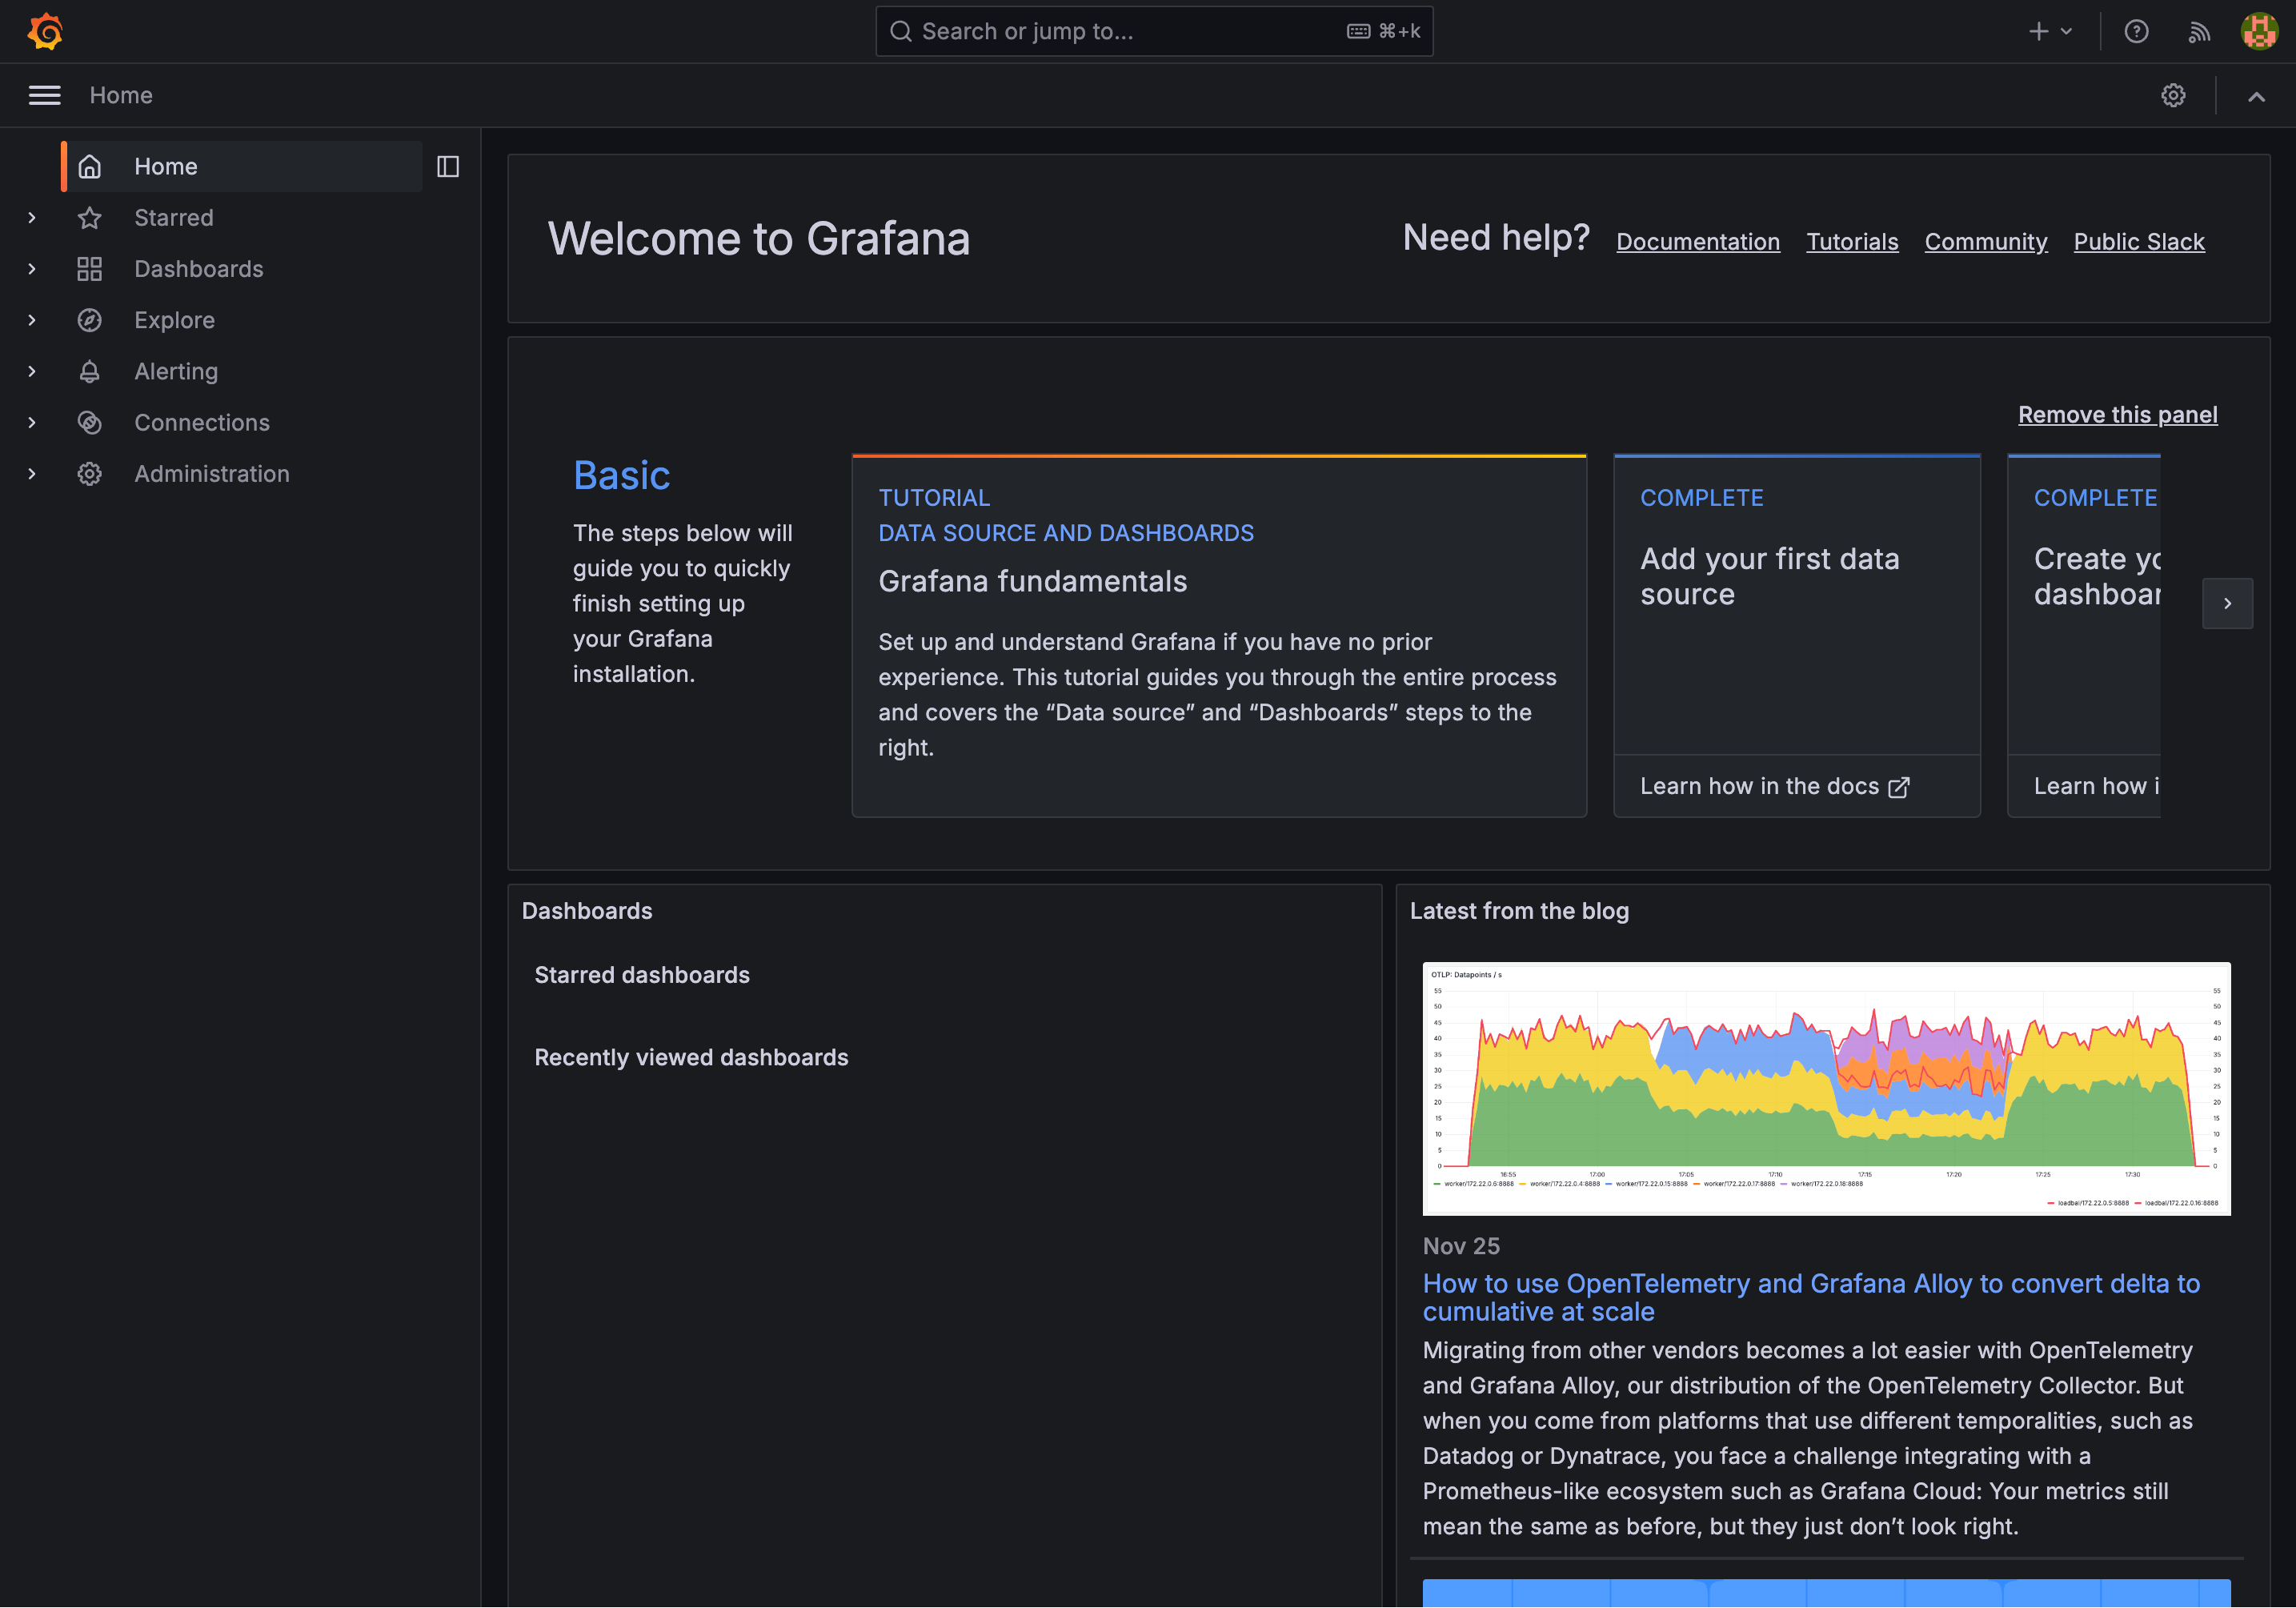
|
Take this time to explore Grafana. This is the beauty of what we’ve done: by defining our cluster state as code, if you mess up and do something you don’t like, you can blow it all away and start again. |
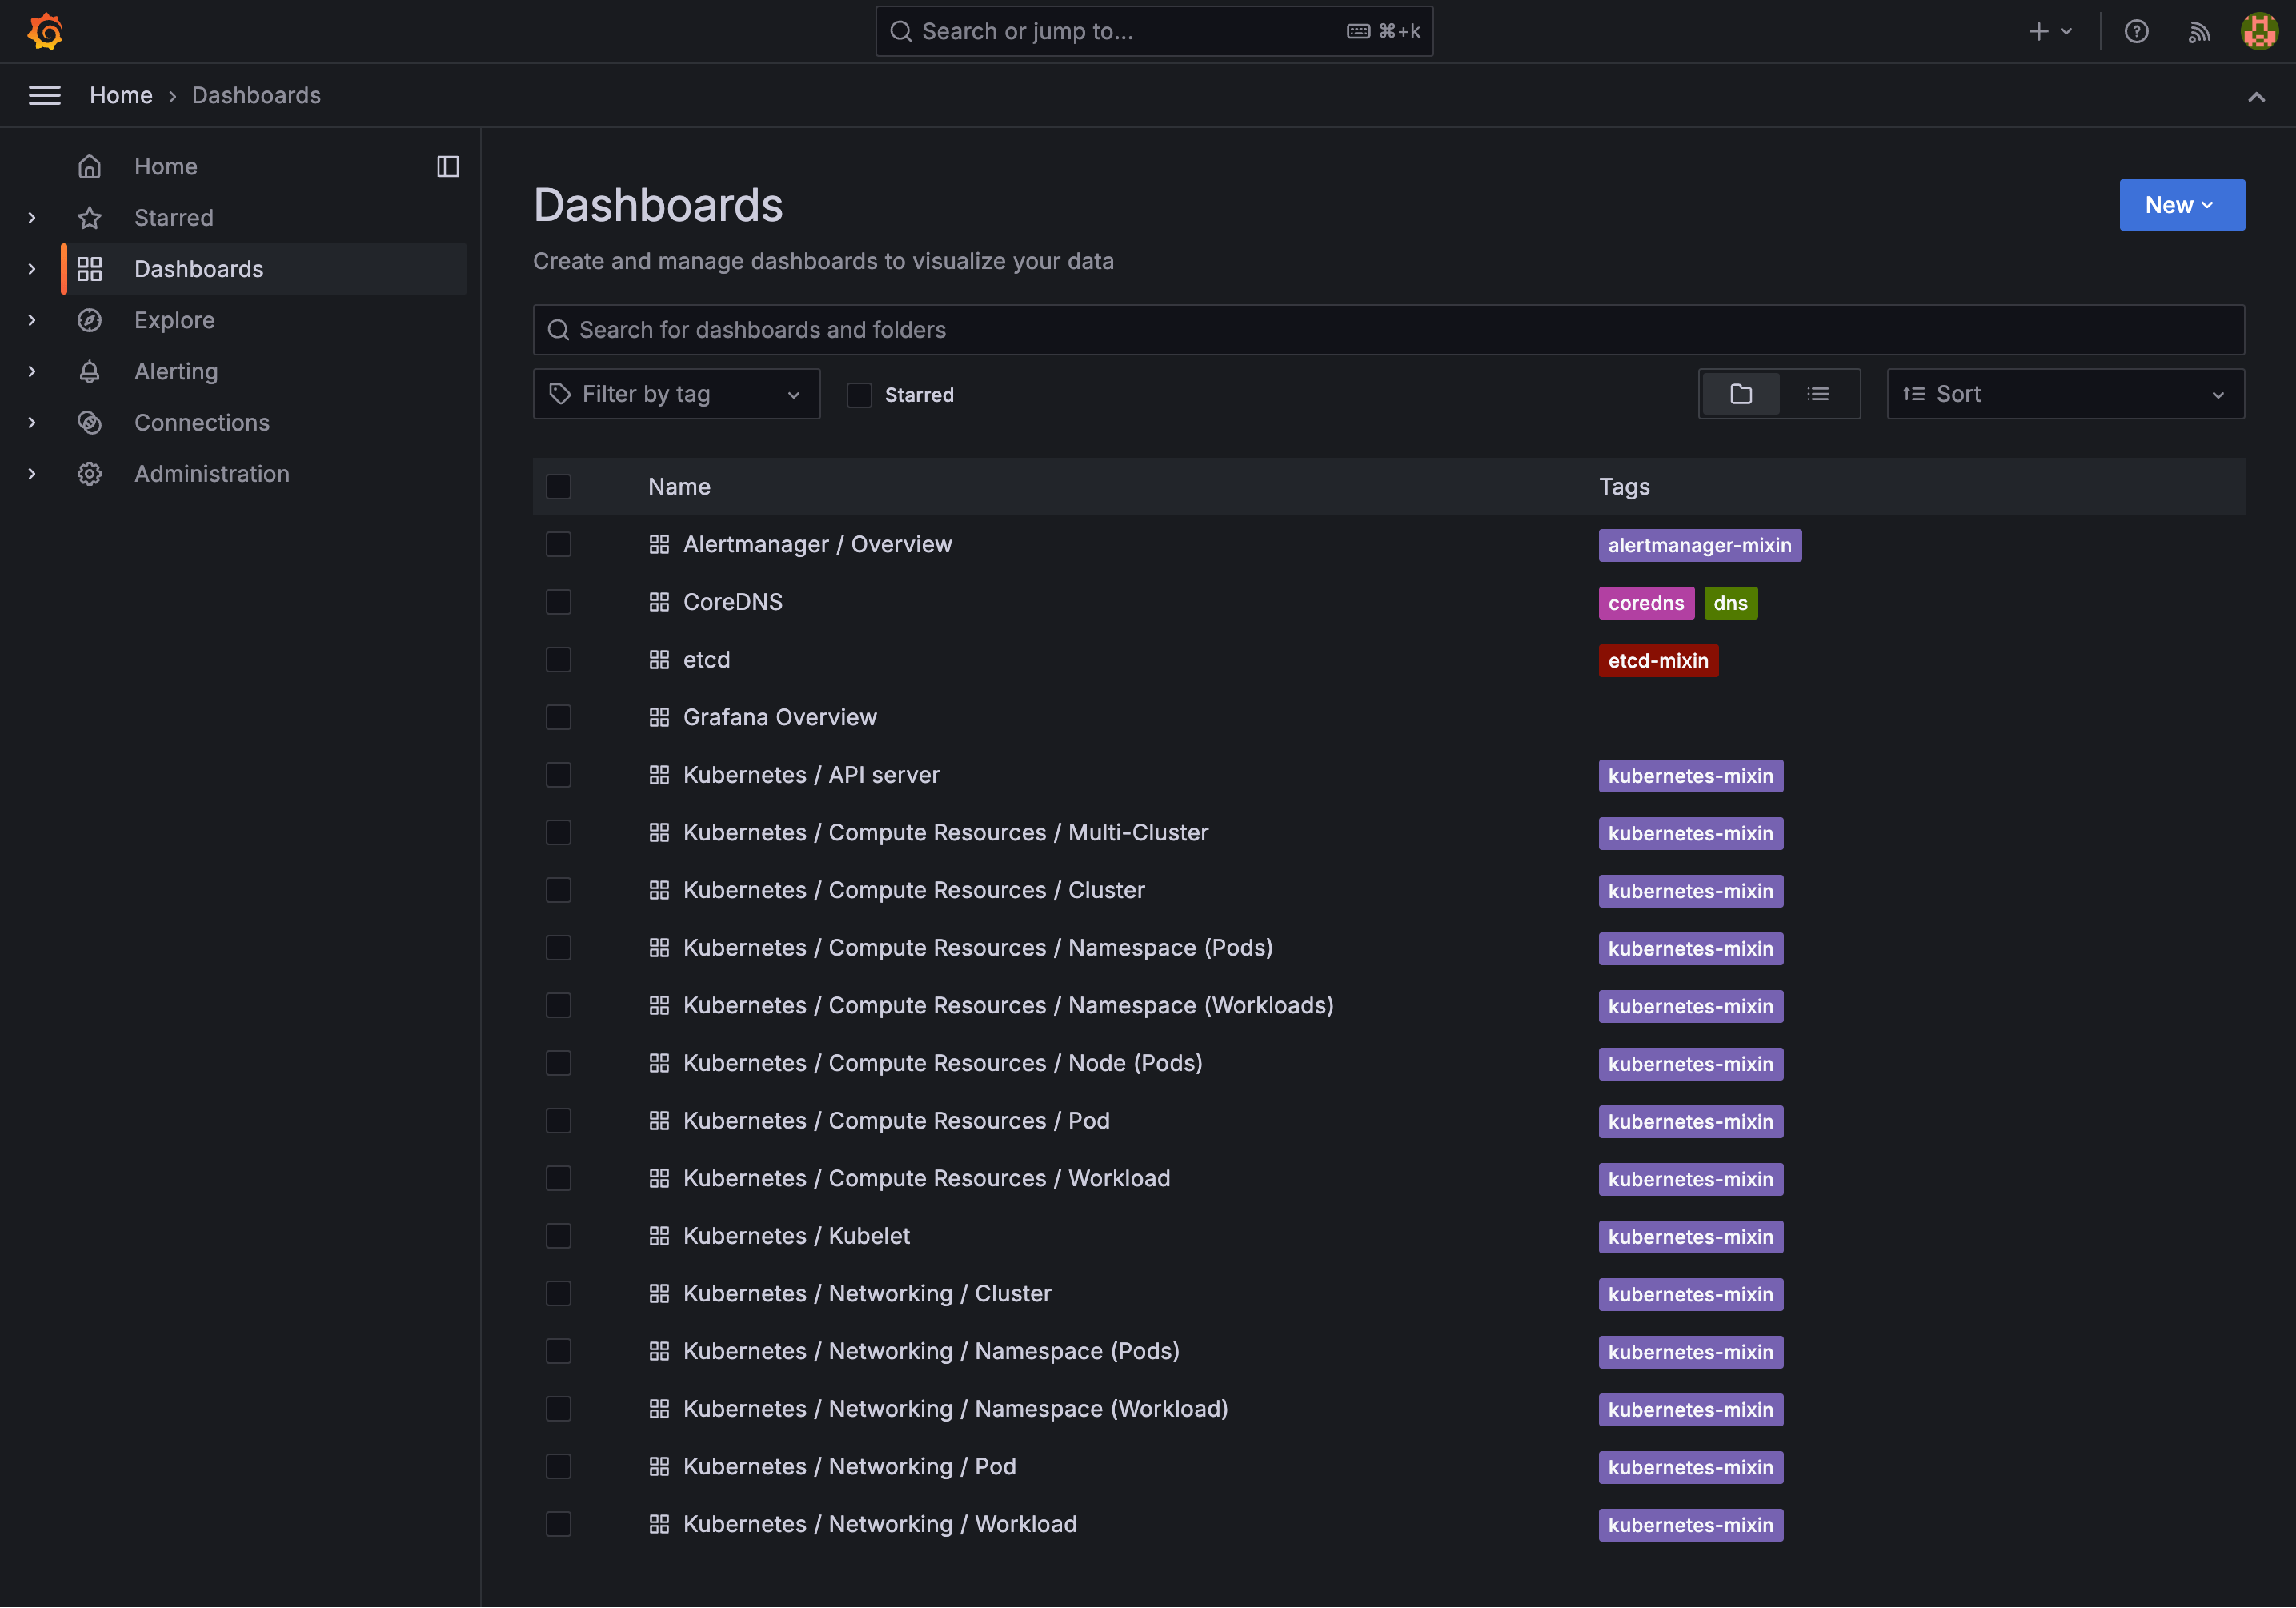
The observability stack comes with a bunch of pre-built dashboards:
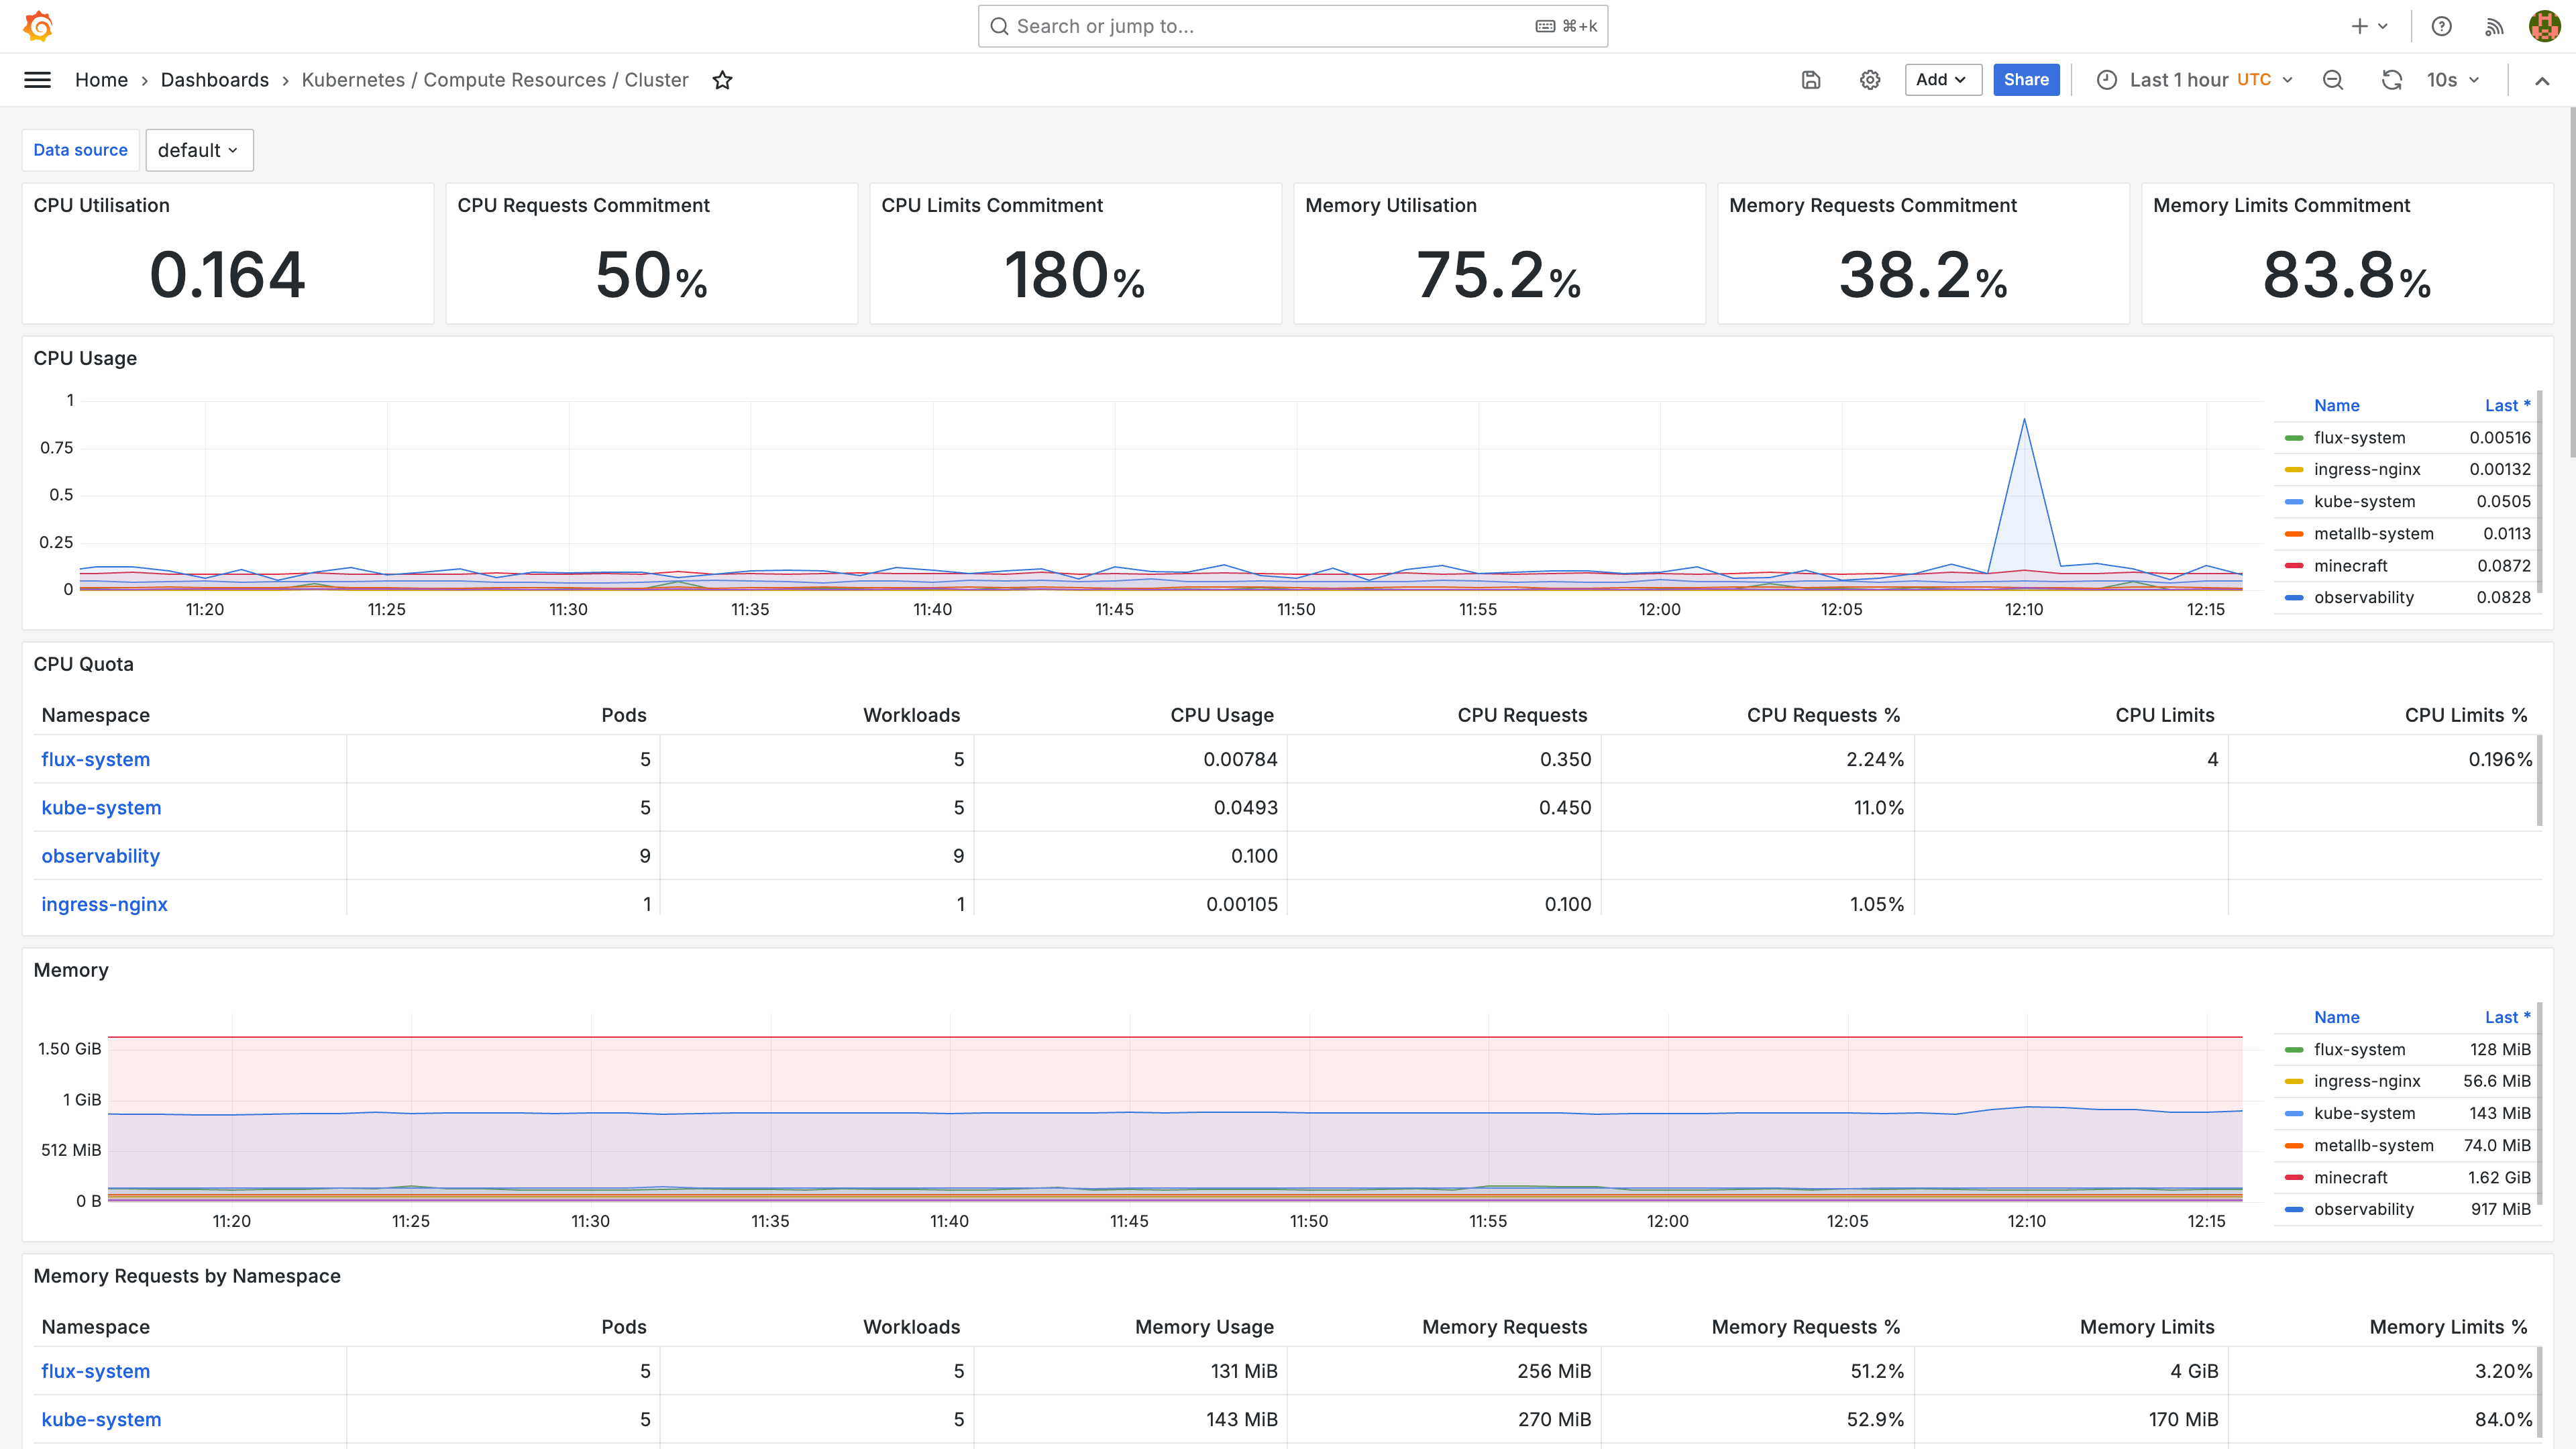
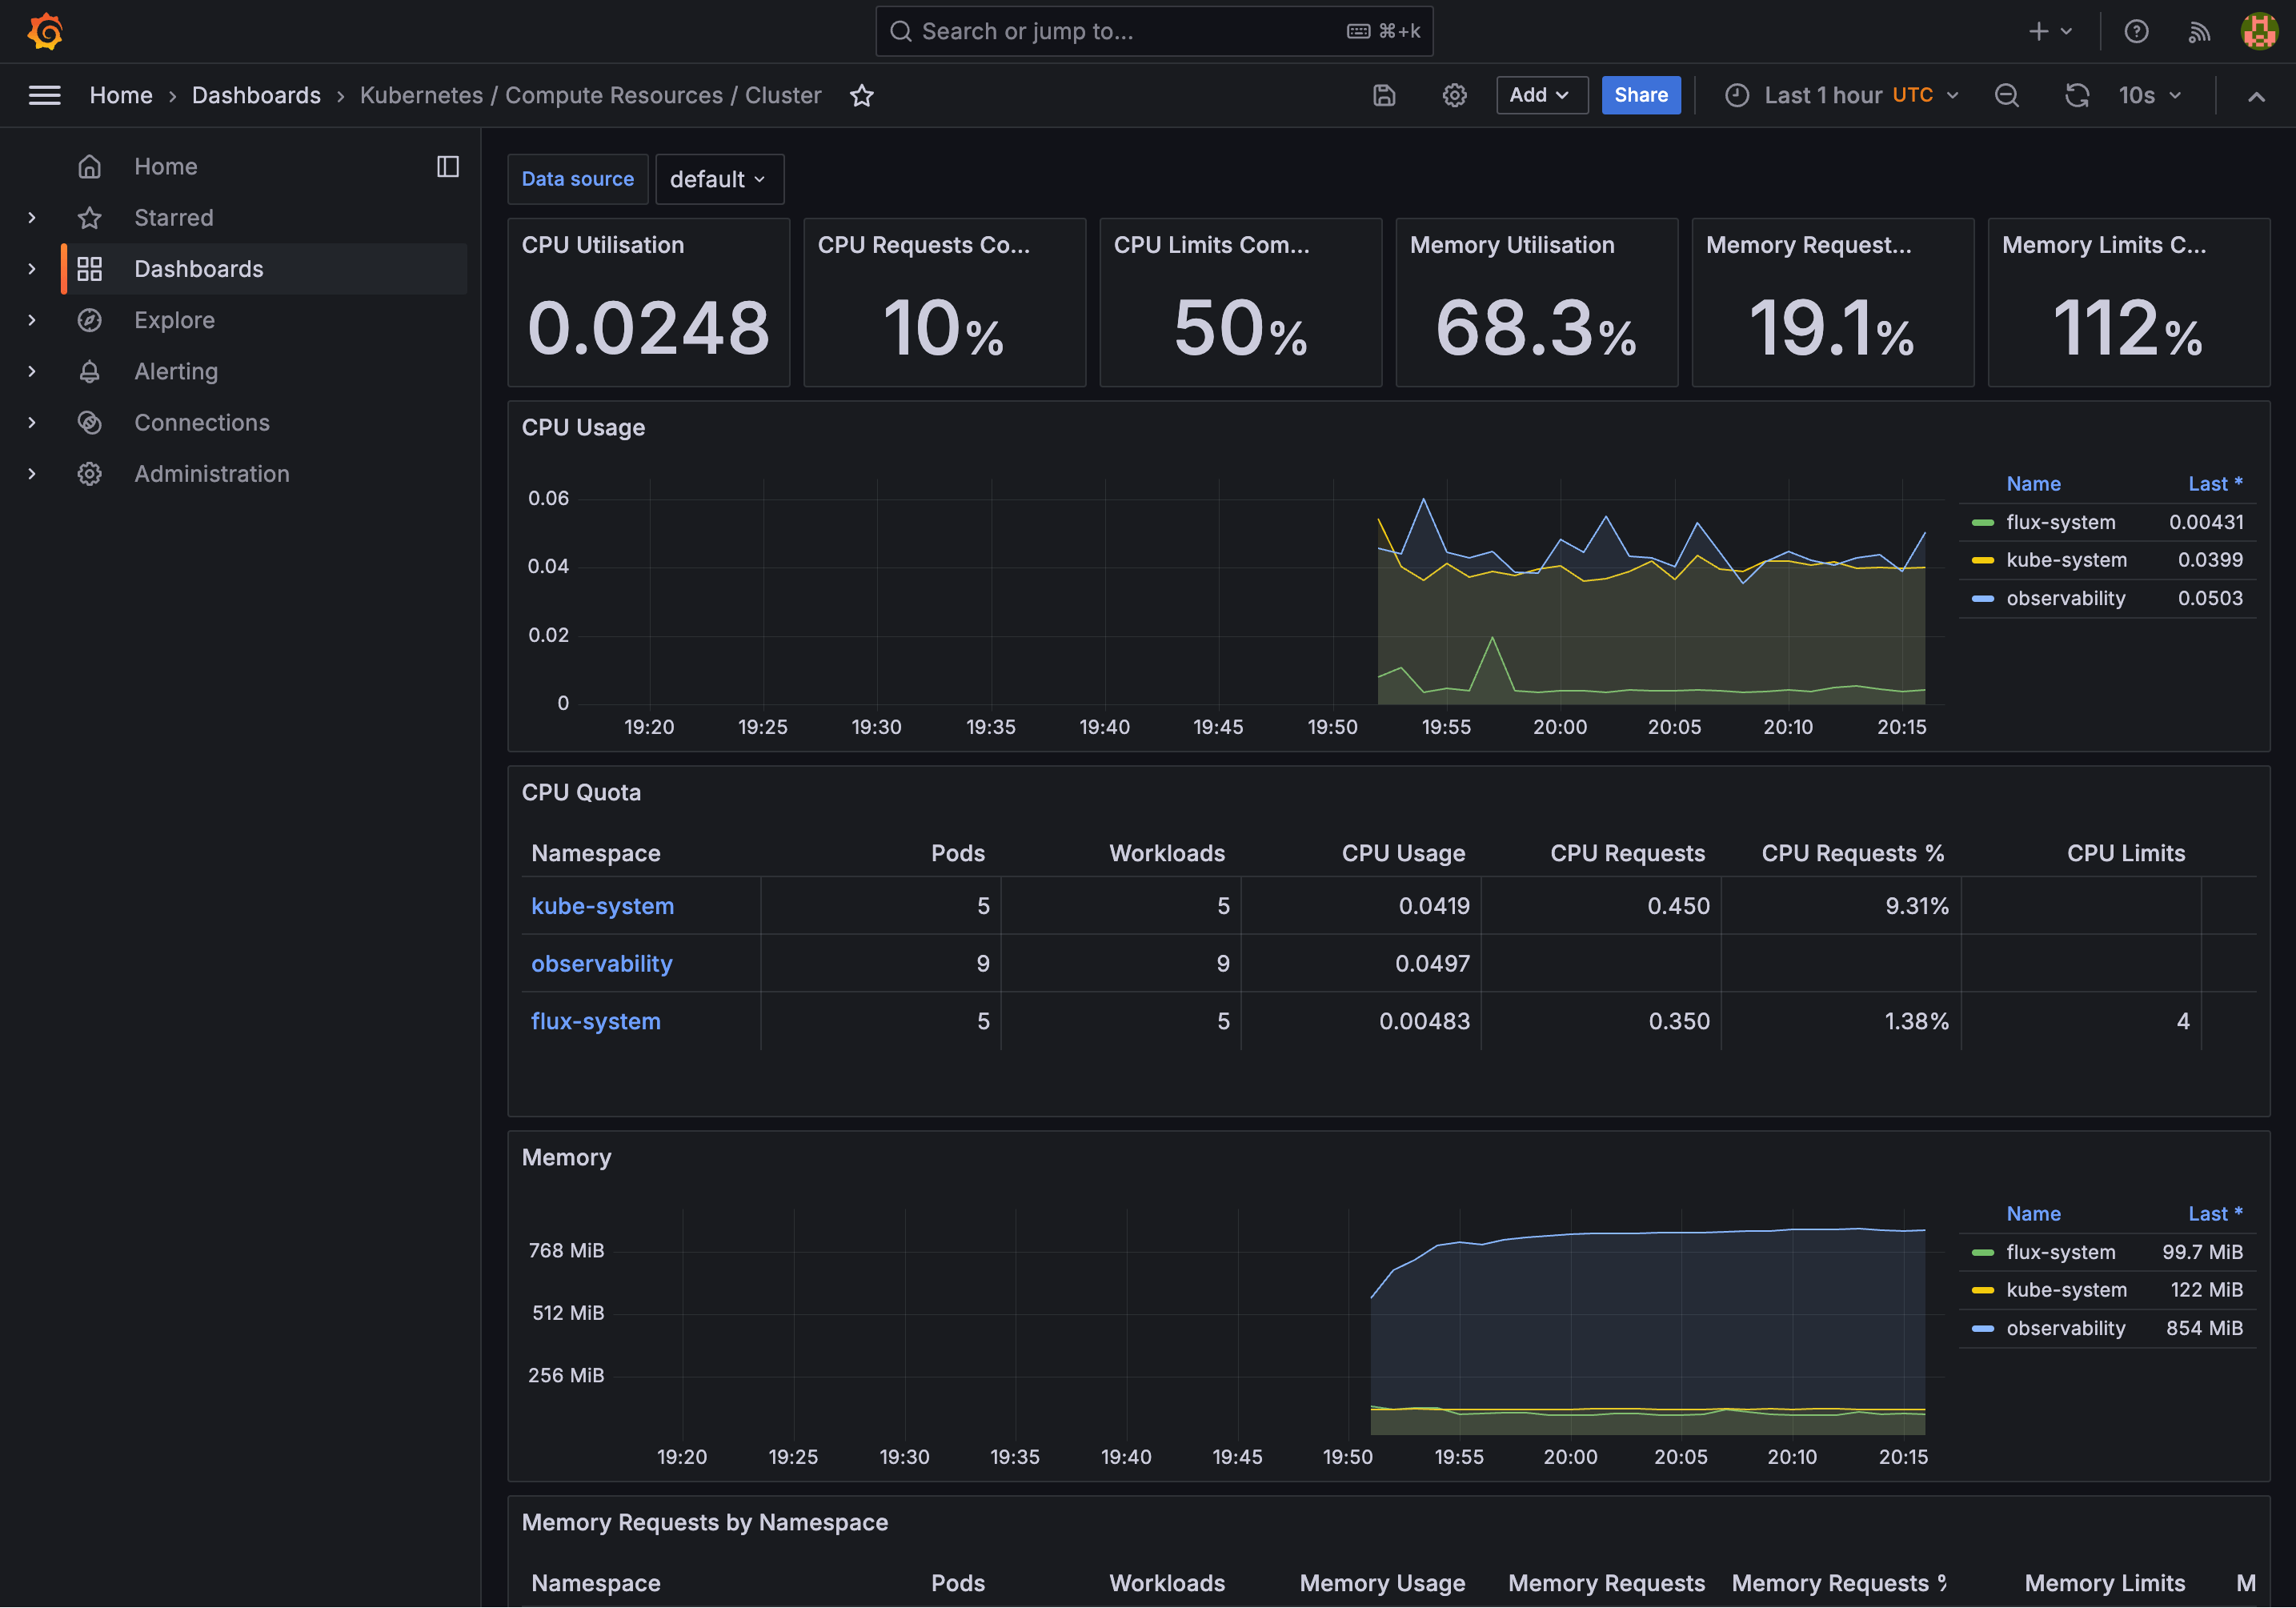
Here’s one which shows an overview of the Kubernetes cluster:
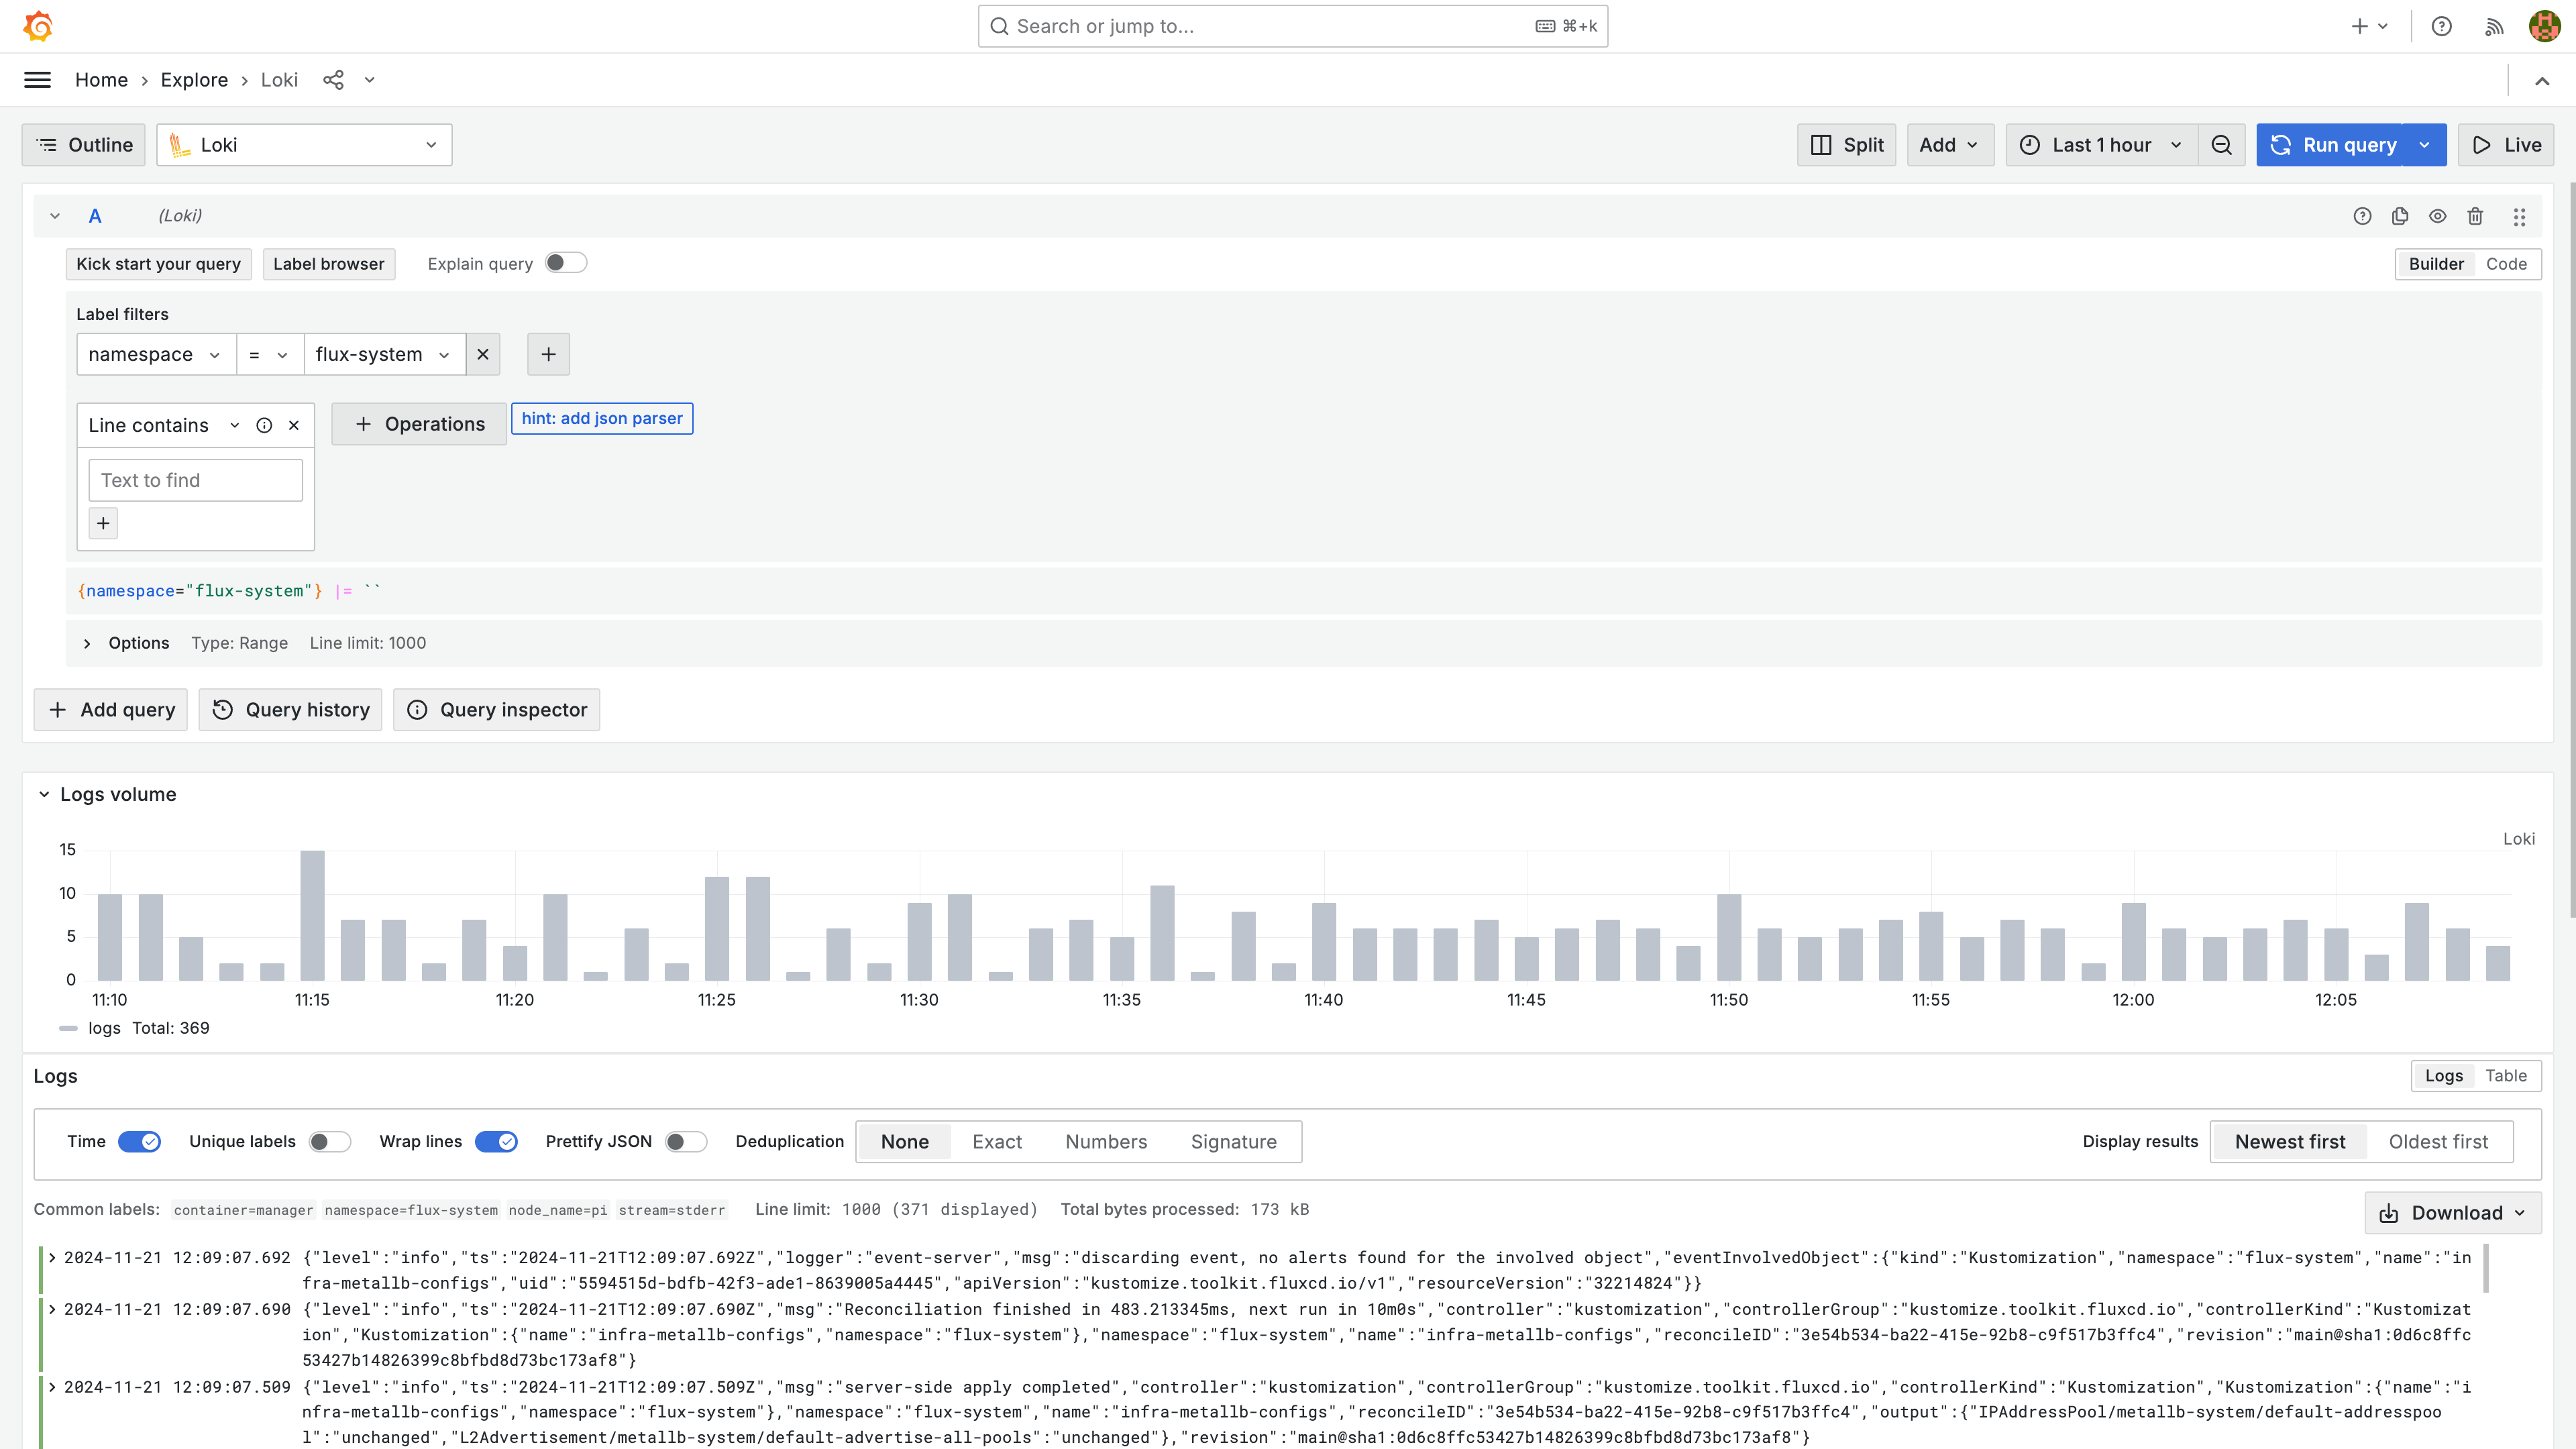
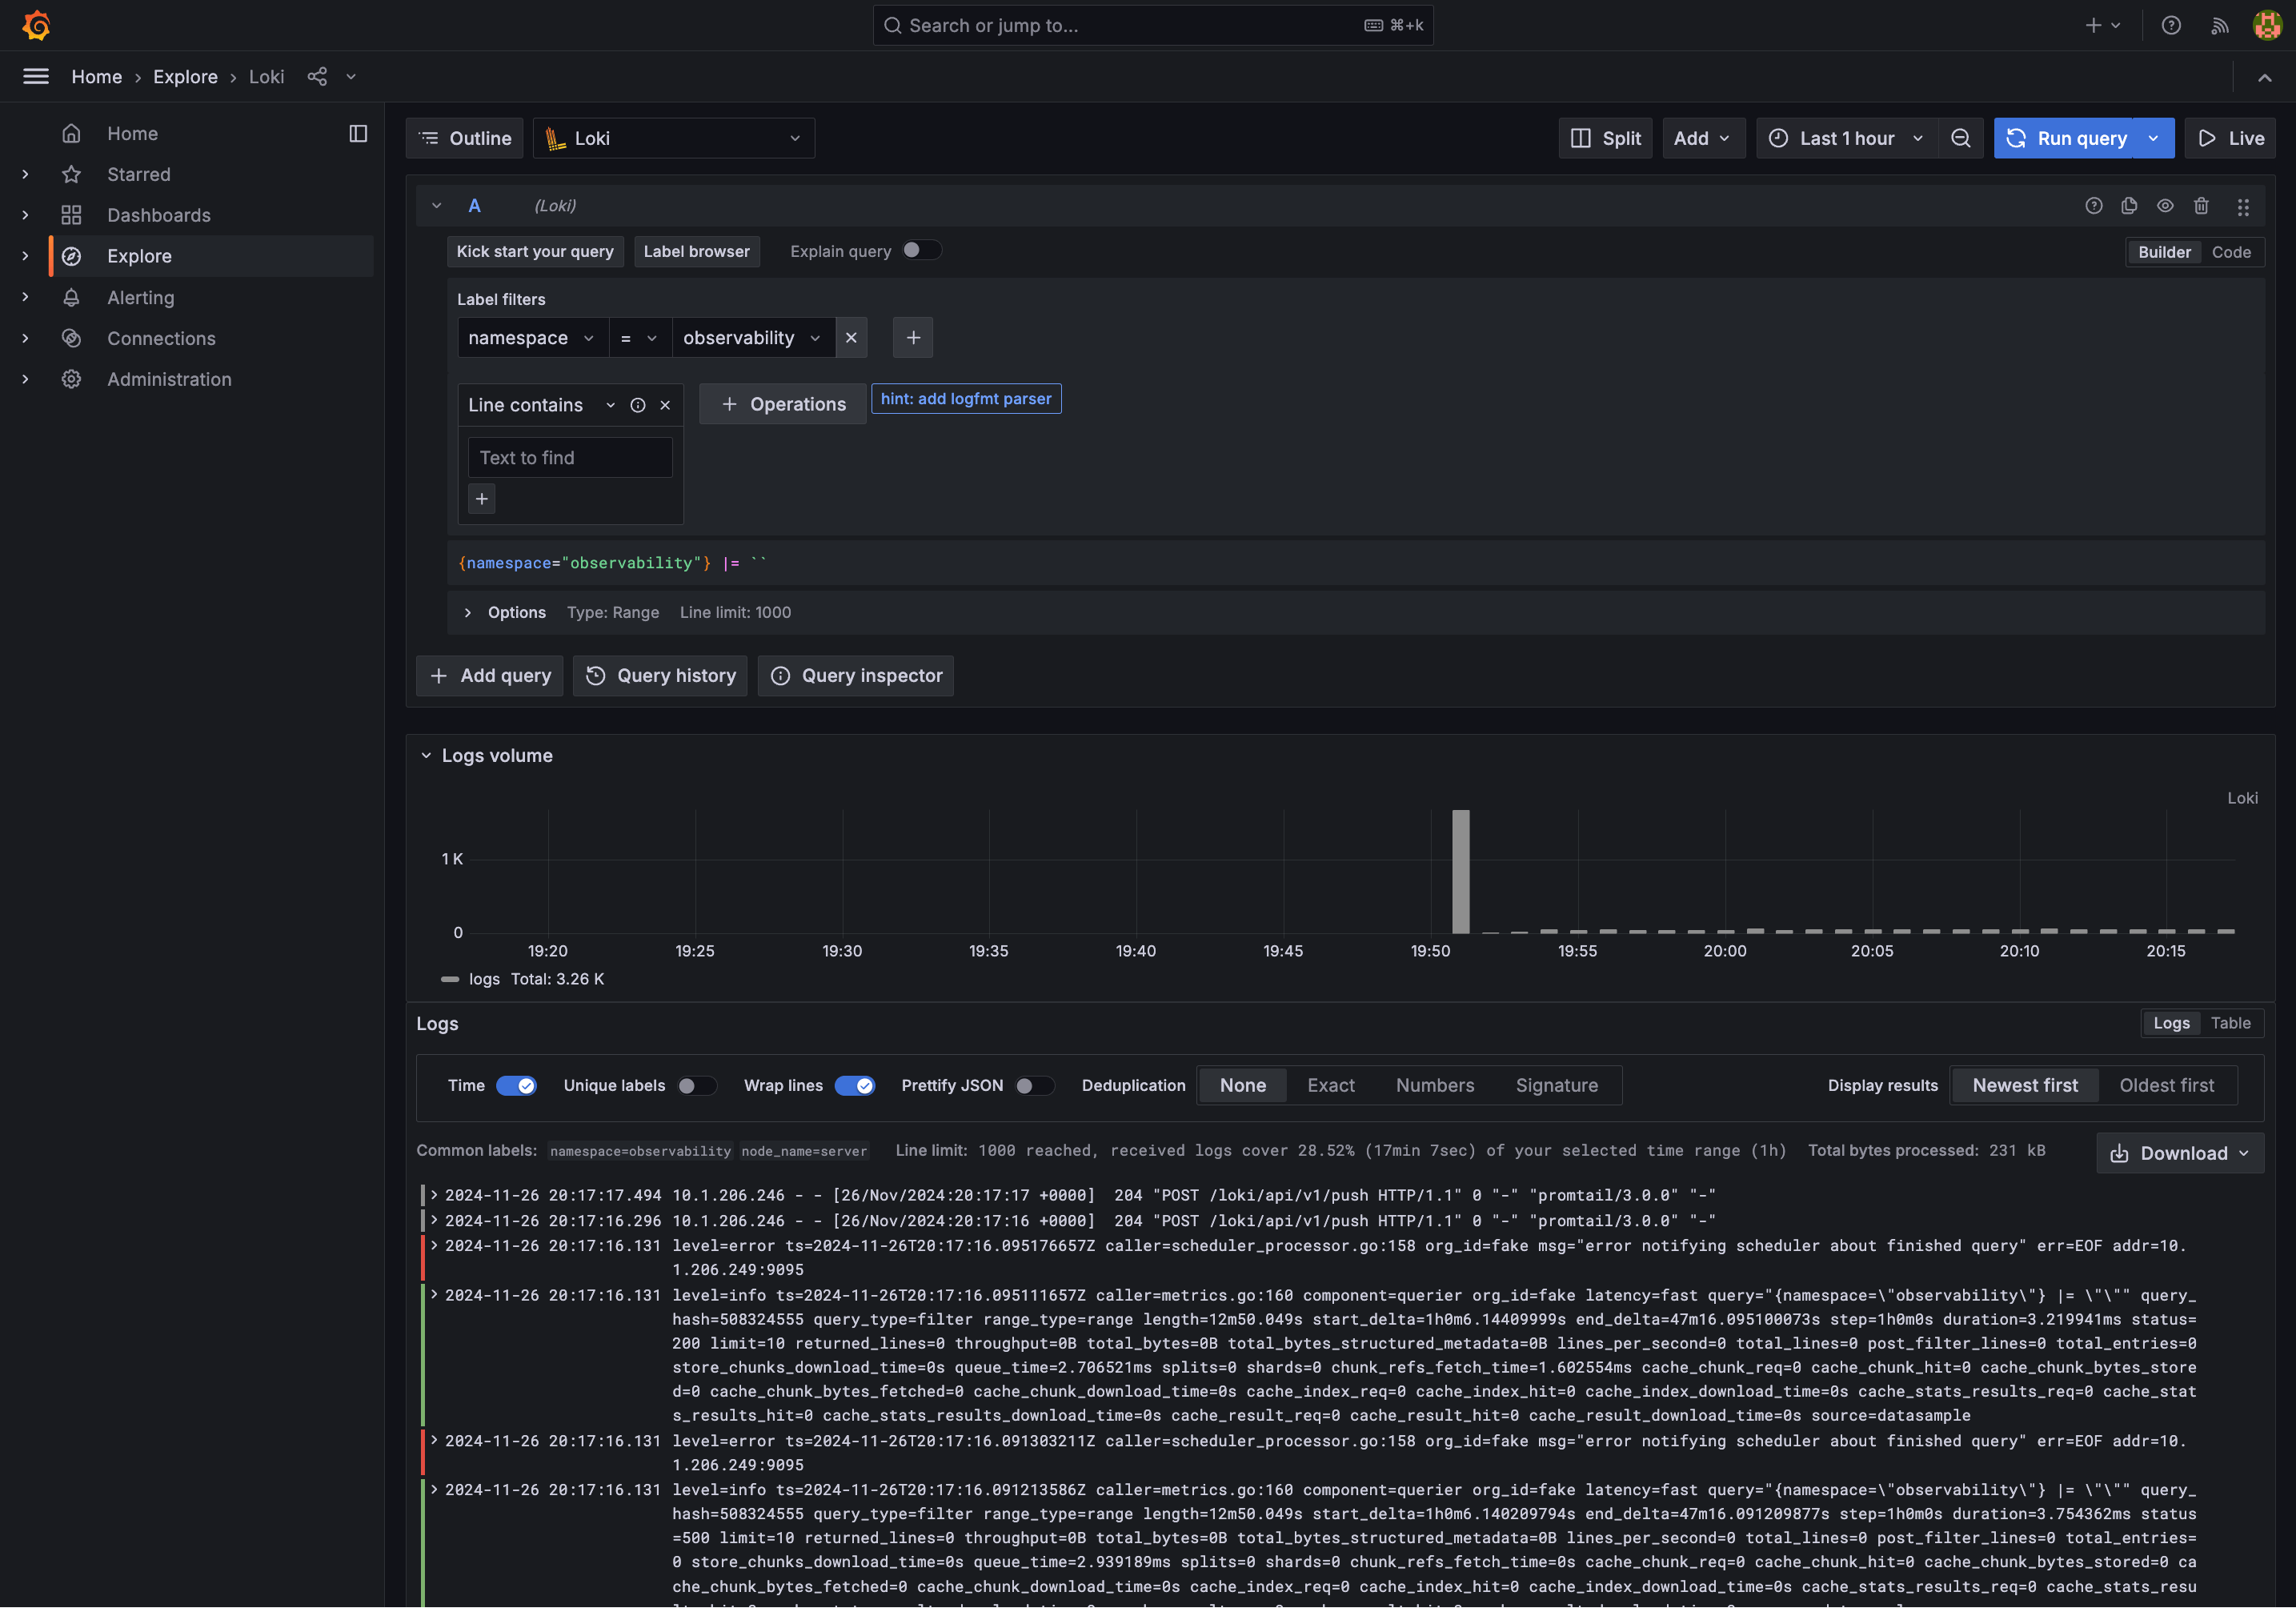
Go to the "Explore" tab and try out Loki, where we can see cluster logs. Much more convenient than SSH’ing into the cluster and running kubectl commands:
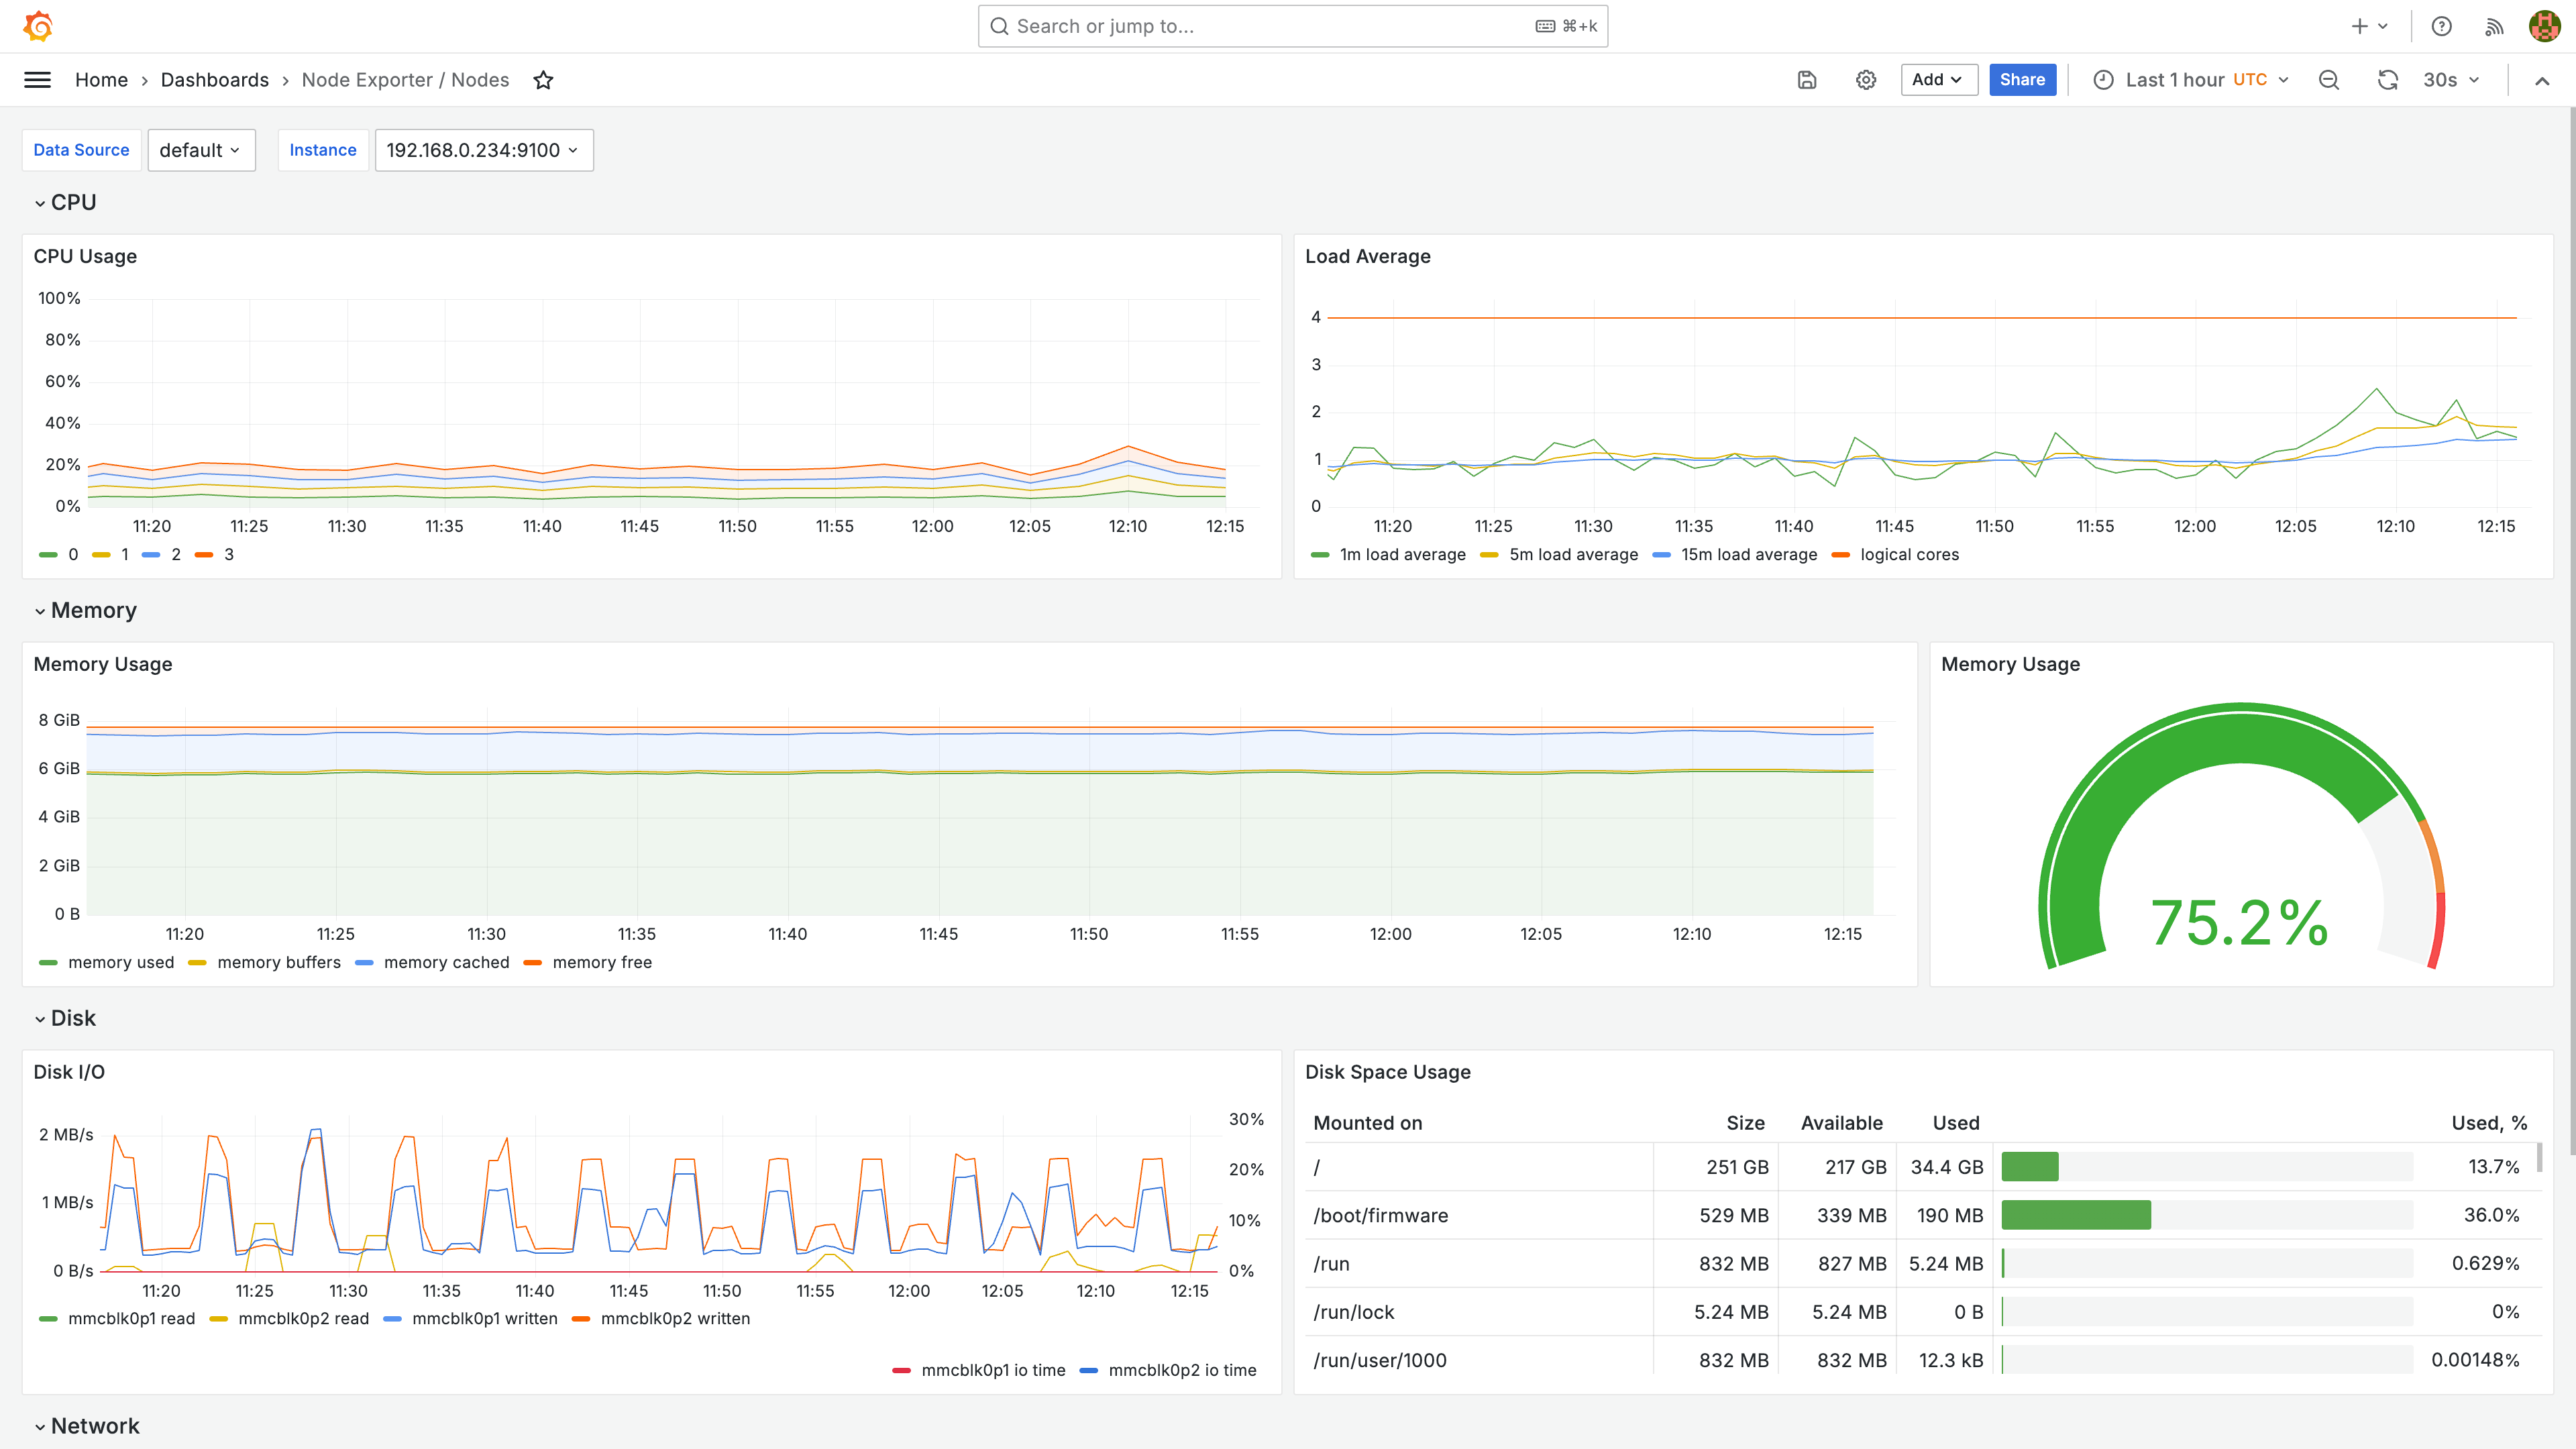
The "Node Exporter" dashboard shows an overview of the actual machine (the Kubernetes cluster runs in the machine):
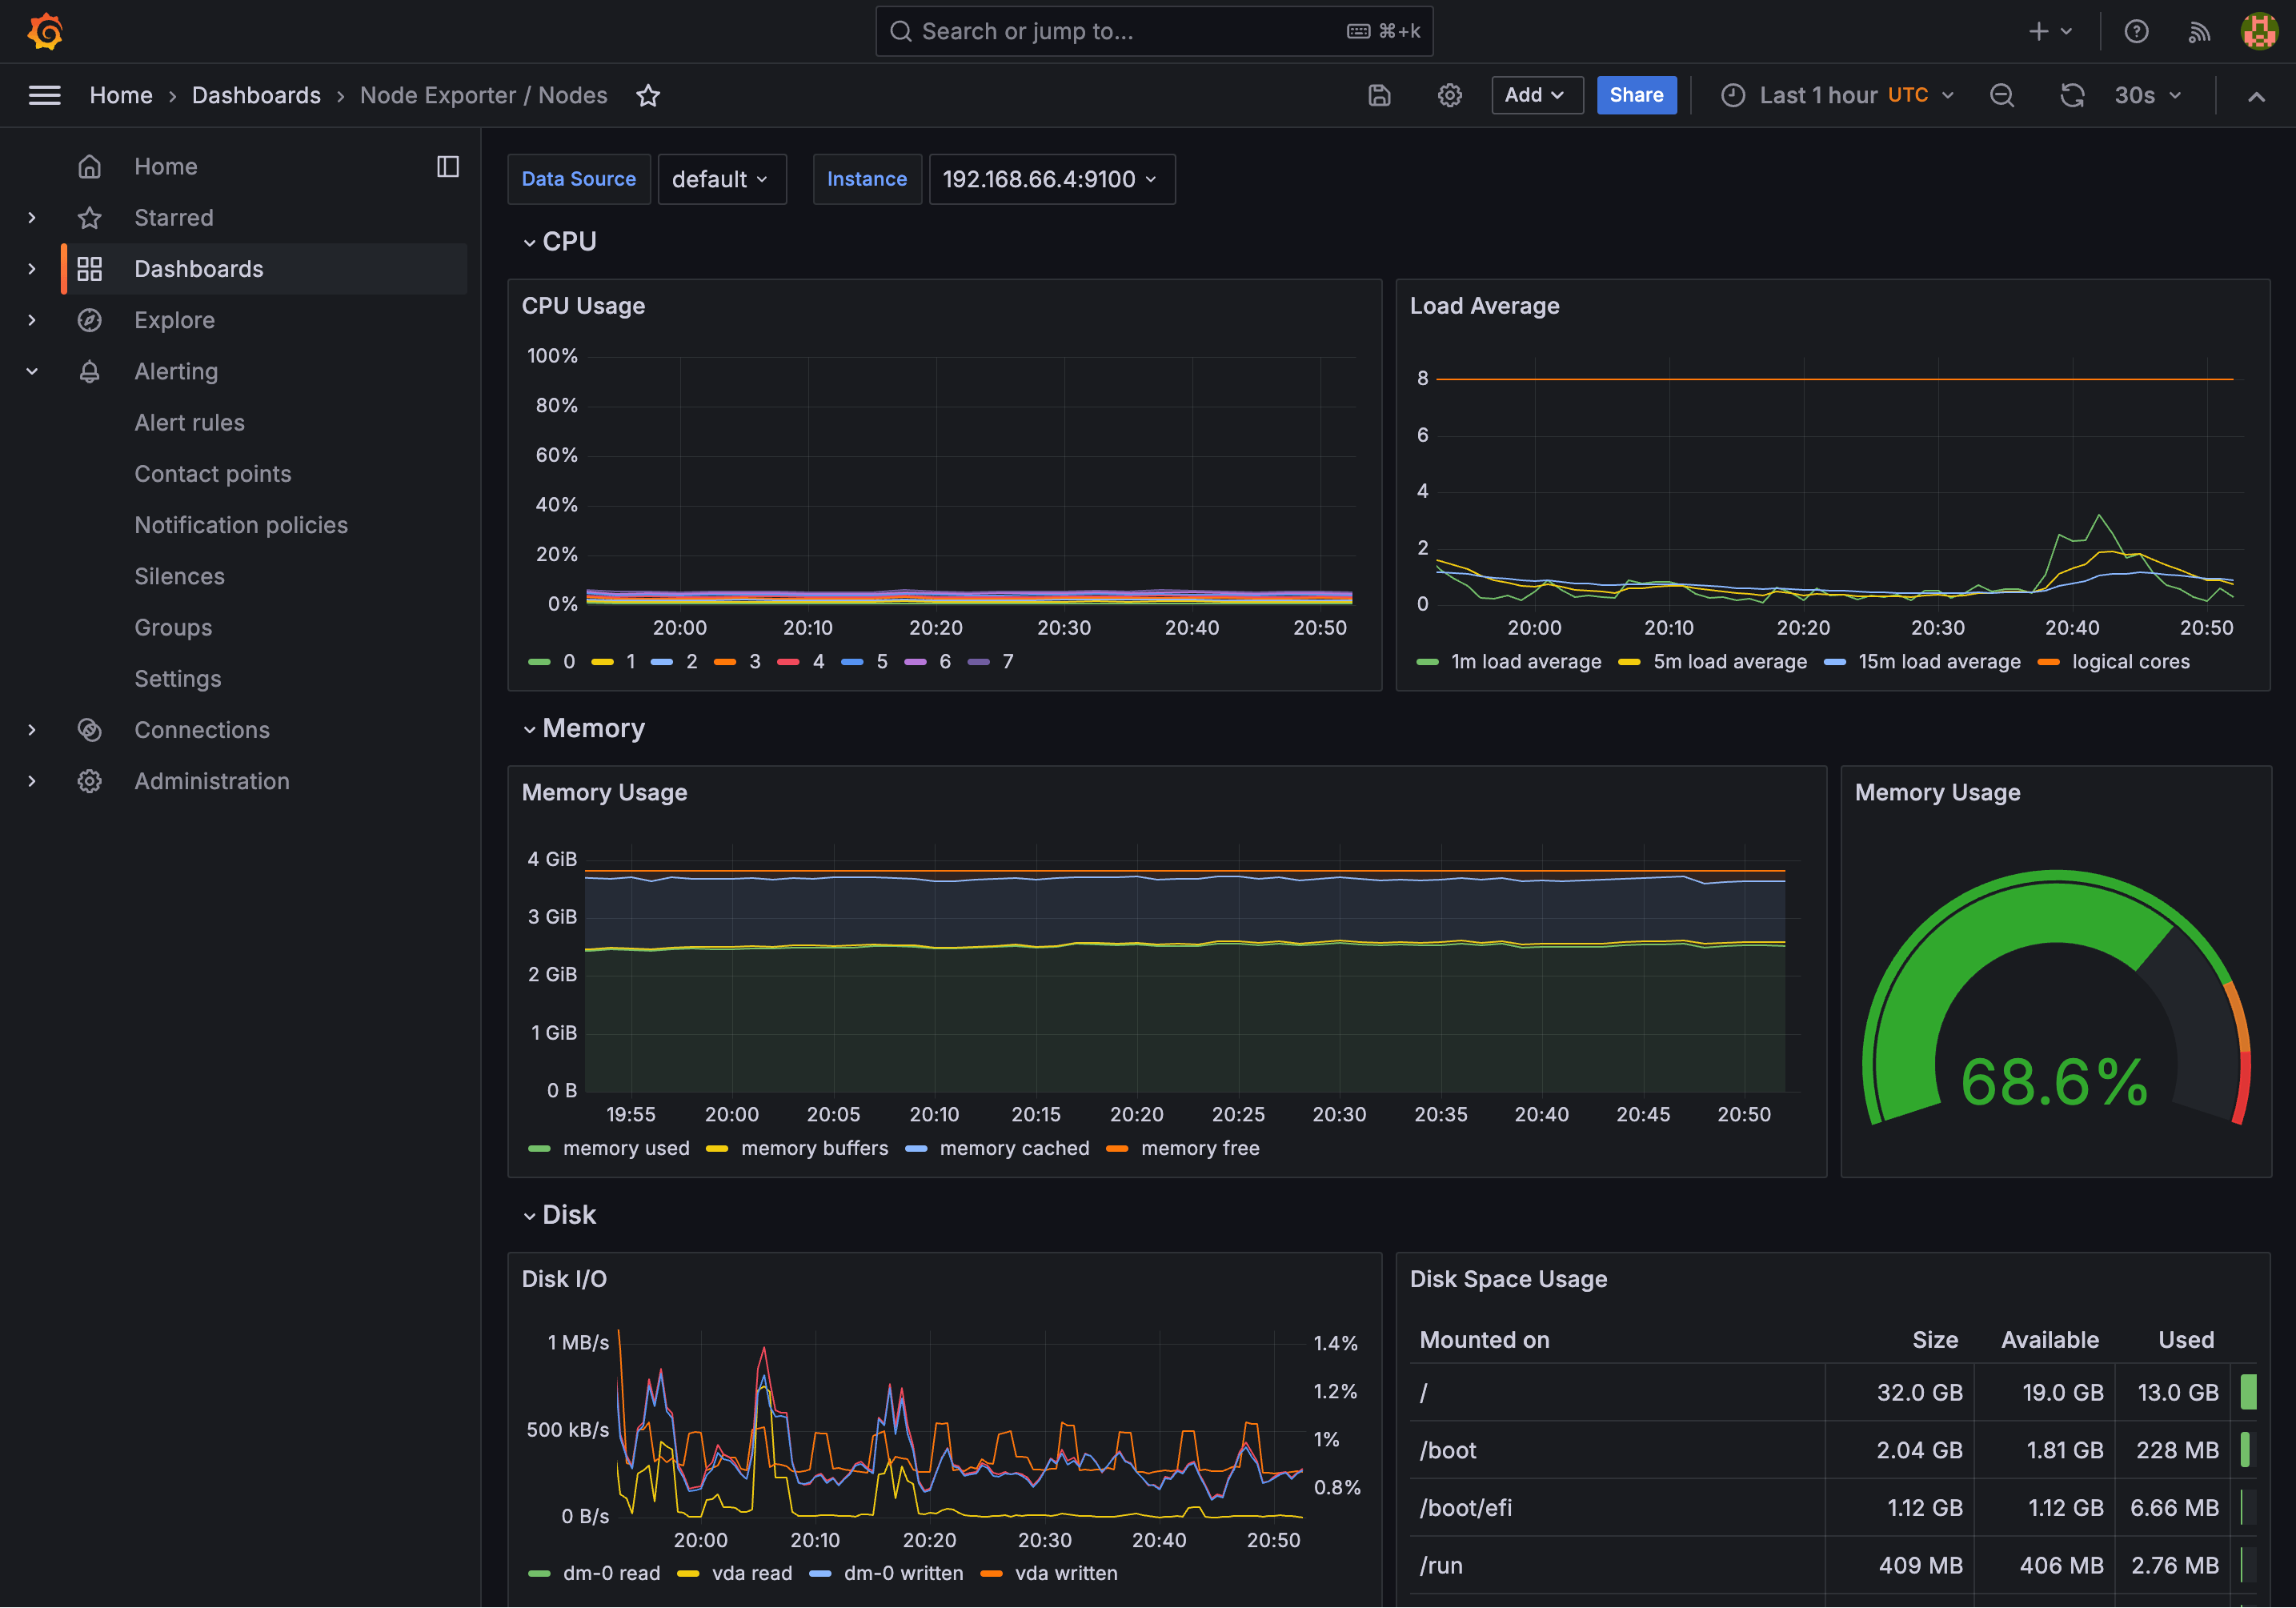
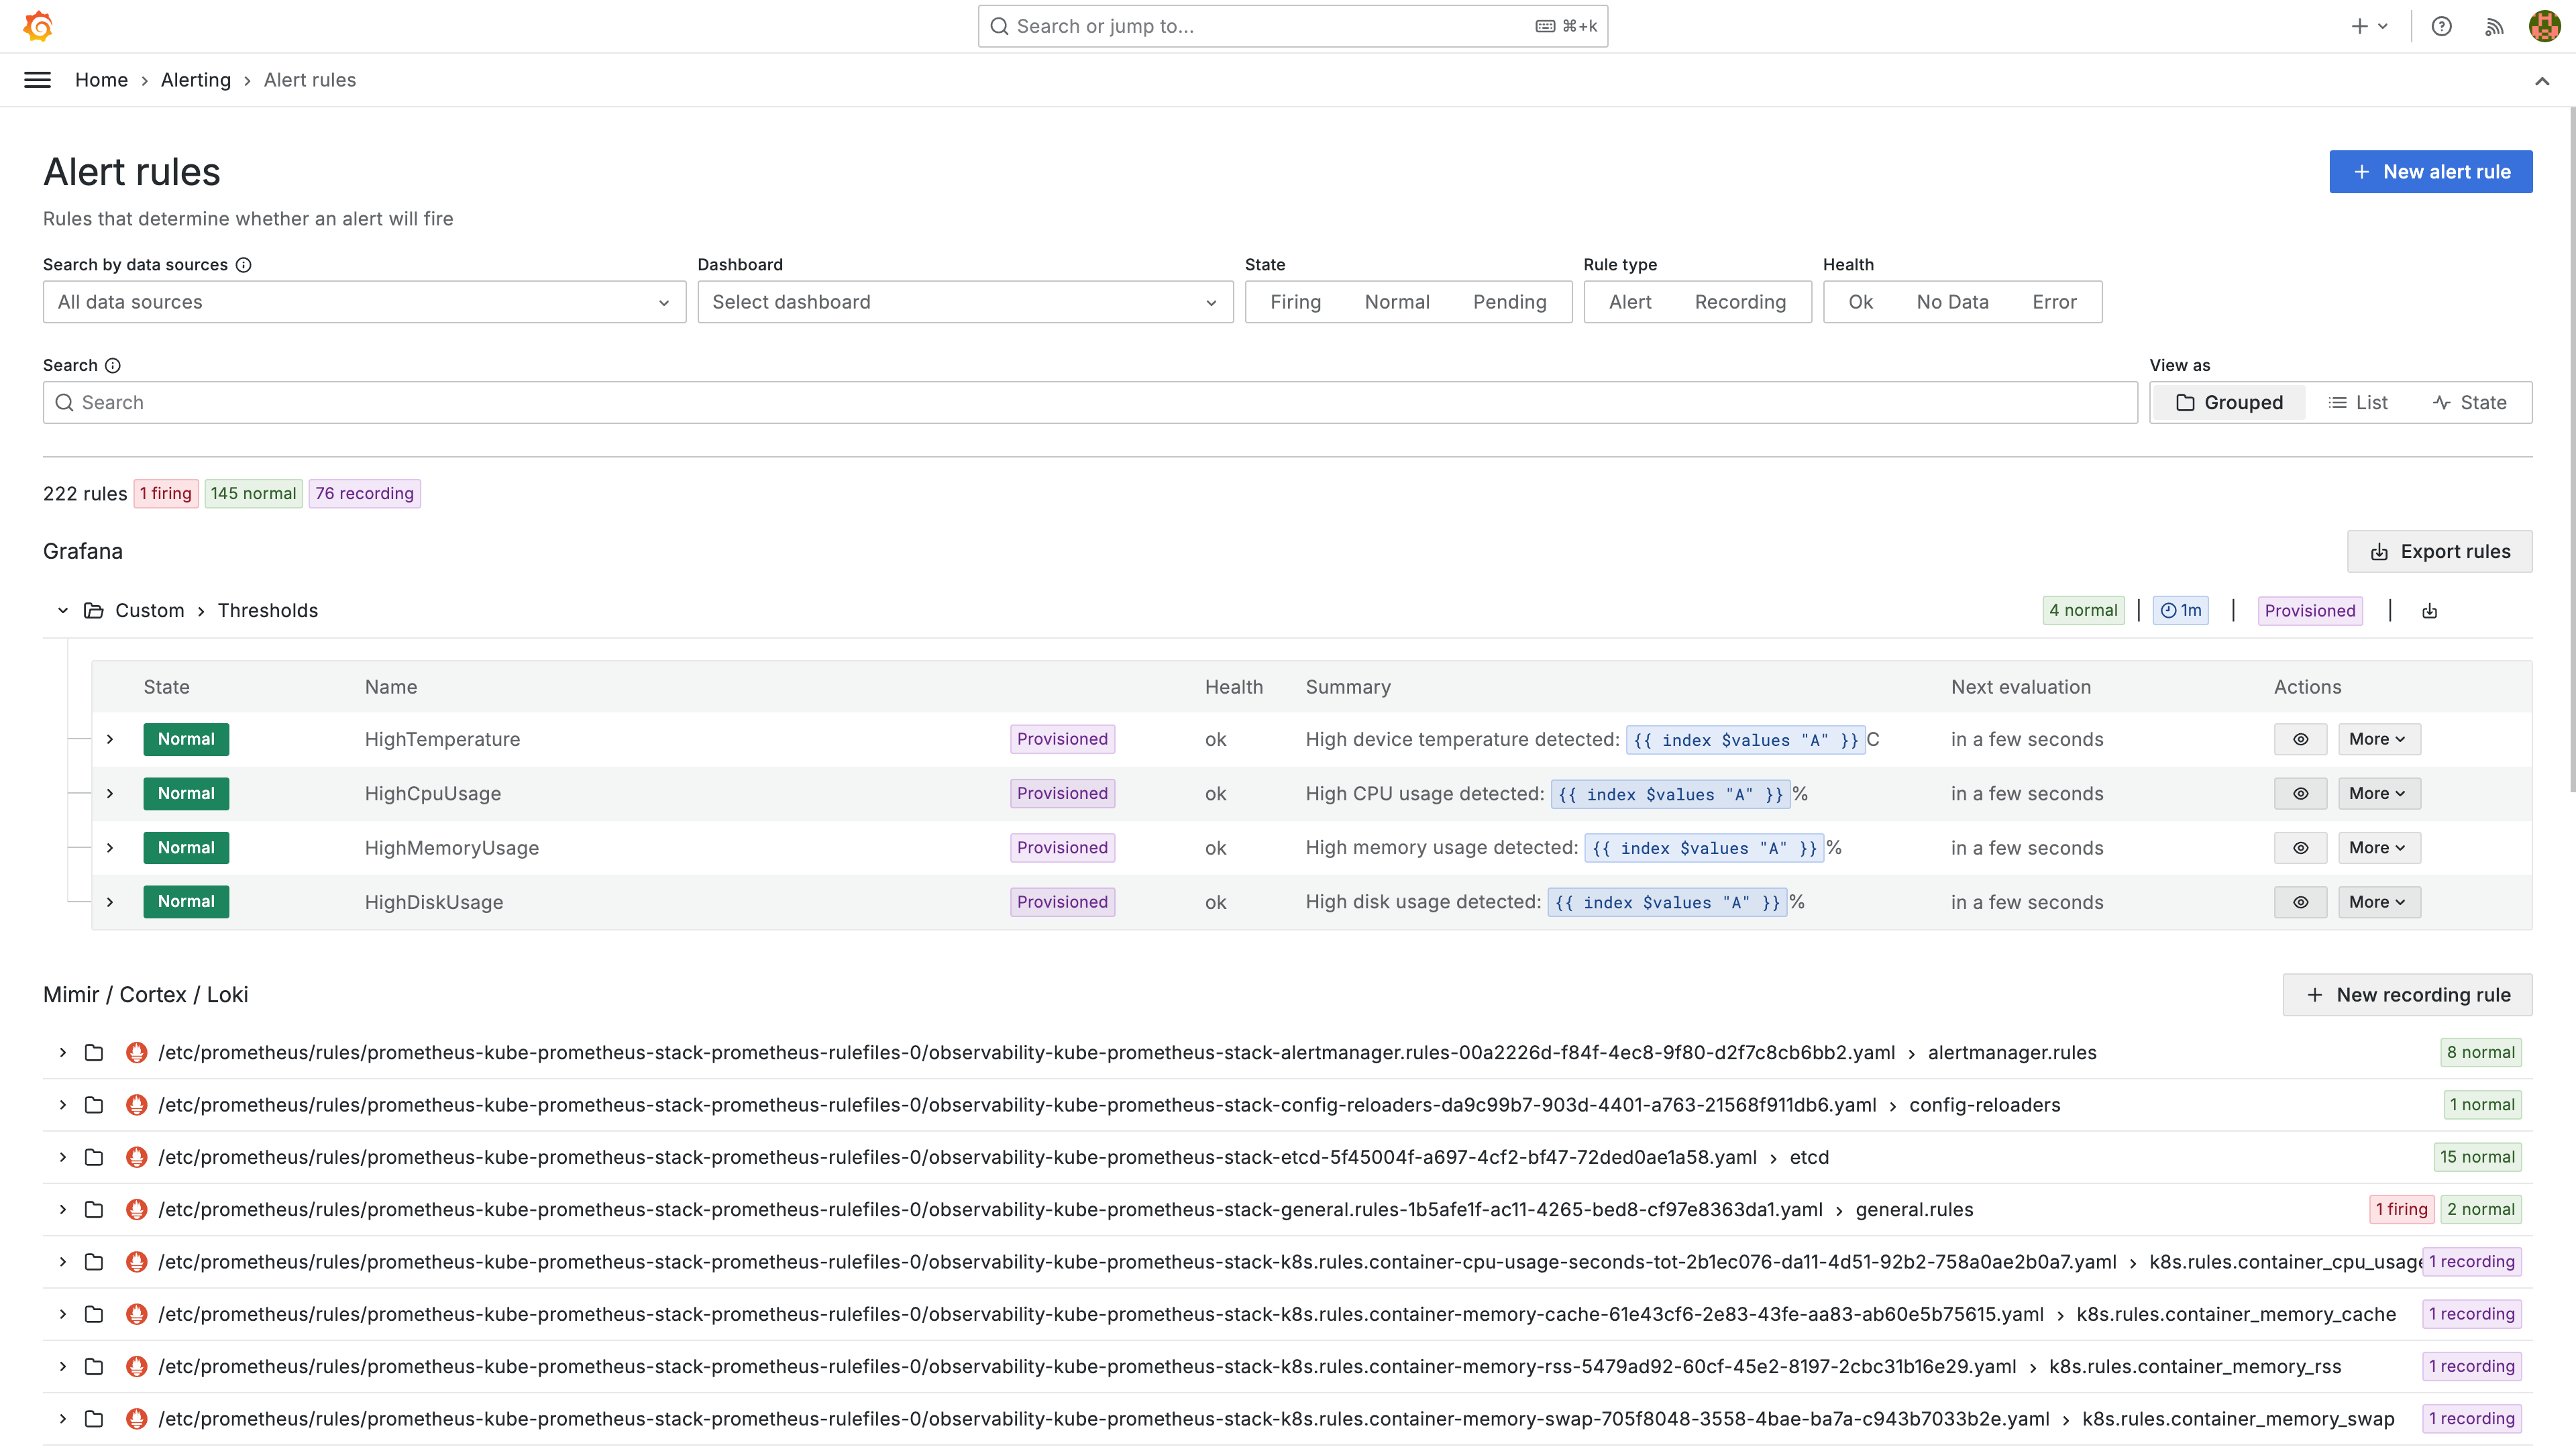
This is great. But what happens if memory usage reaches 95% next week, or if you run out of disk space in the night, how will you know? I hope you’re not planning to watch this dashboard for the rest of time. It’s time to configure some alerts.
Stay tuned for the next post where we’ll get right into it.