Set up Grafana Alerts for your Home Server
In the previous post we set up an Observability stack for our home server with Prometheus, Grafana and Loki. We have lovely dashboards and logs to monitor our server. But what if we want to be alerted when something goes wrong? In this post we’ll set up Grafana alerts, which will email us when our CPU/memory/disk usage and temperature is too high.


Set up an SMTP Server
We’ll use Mailtrap to provide us an SMTP server. Their free tier gives us 1,000 emails per month, which is plenty.
-
Sign up for a free account at https://mailtrap.io/register/signup.
The email address that you sign up with is the email address that will receive the email alerts.
-
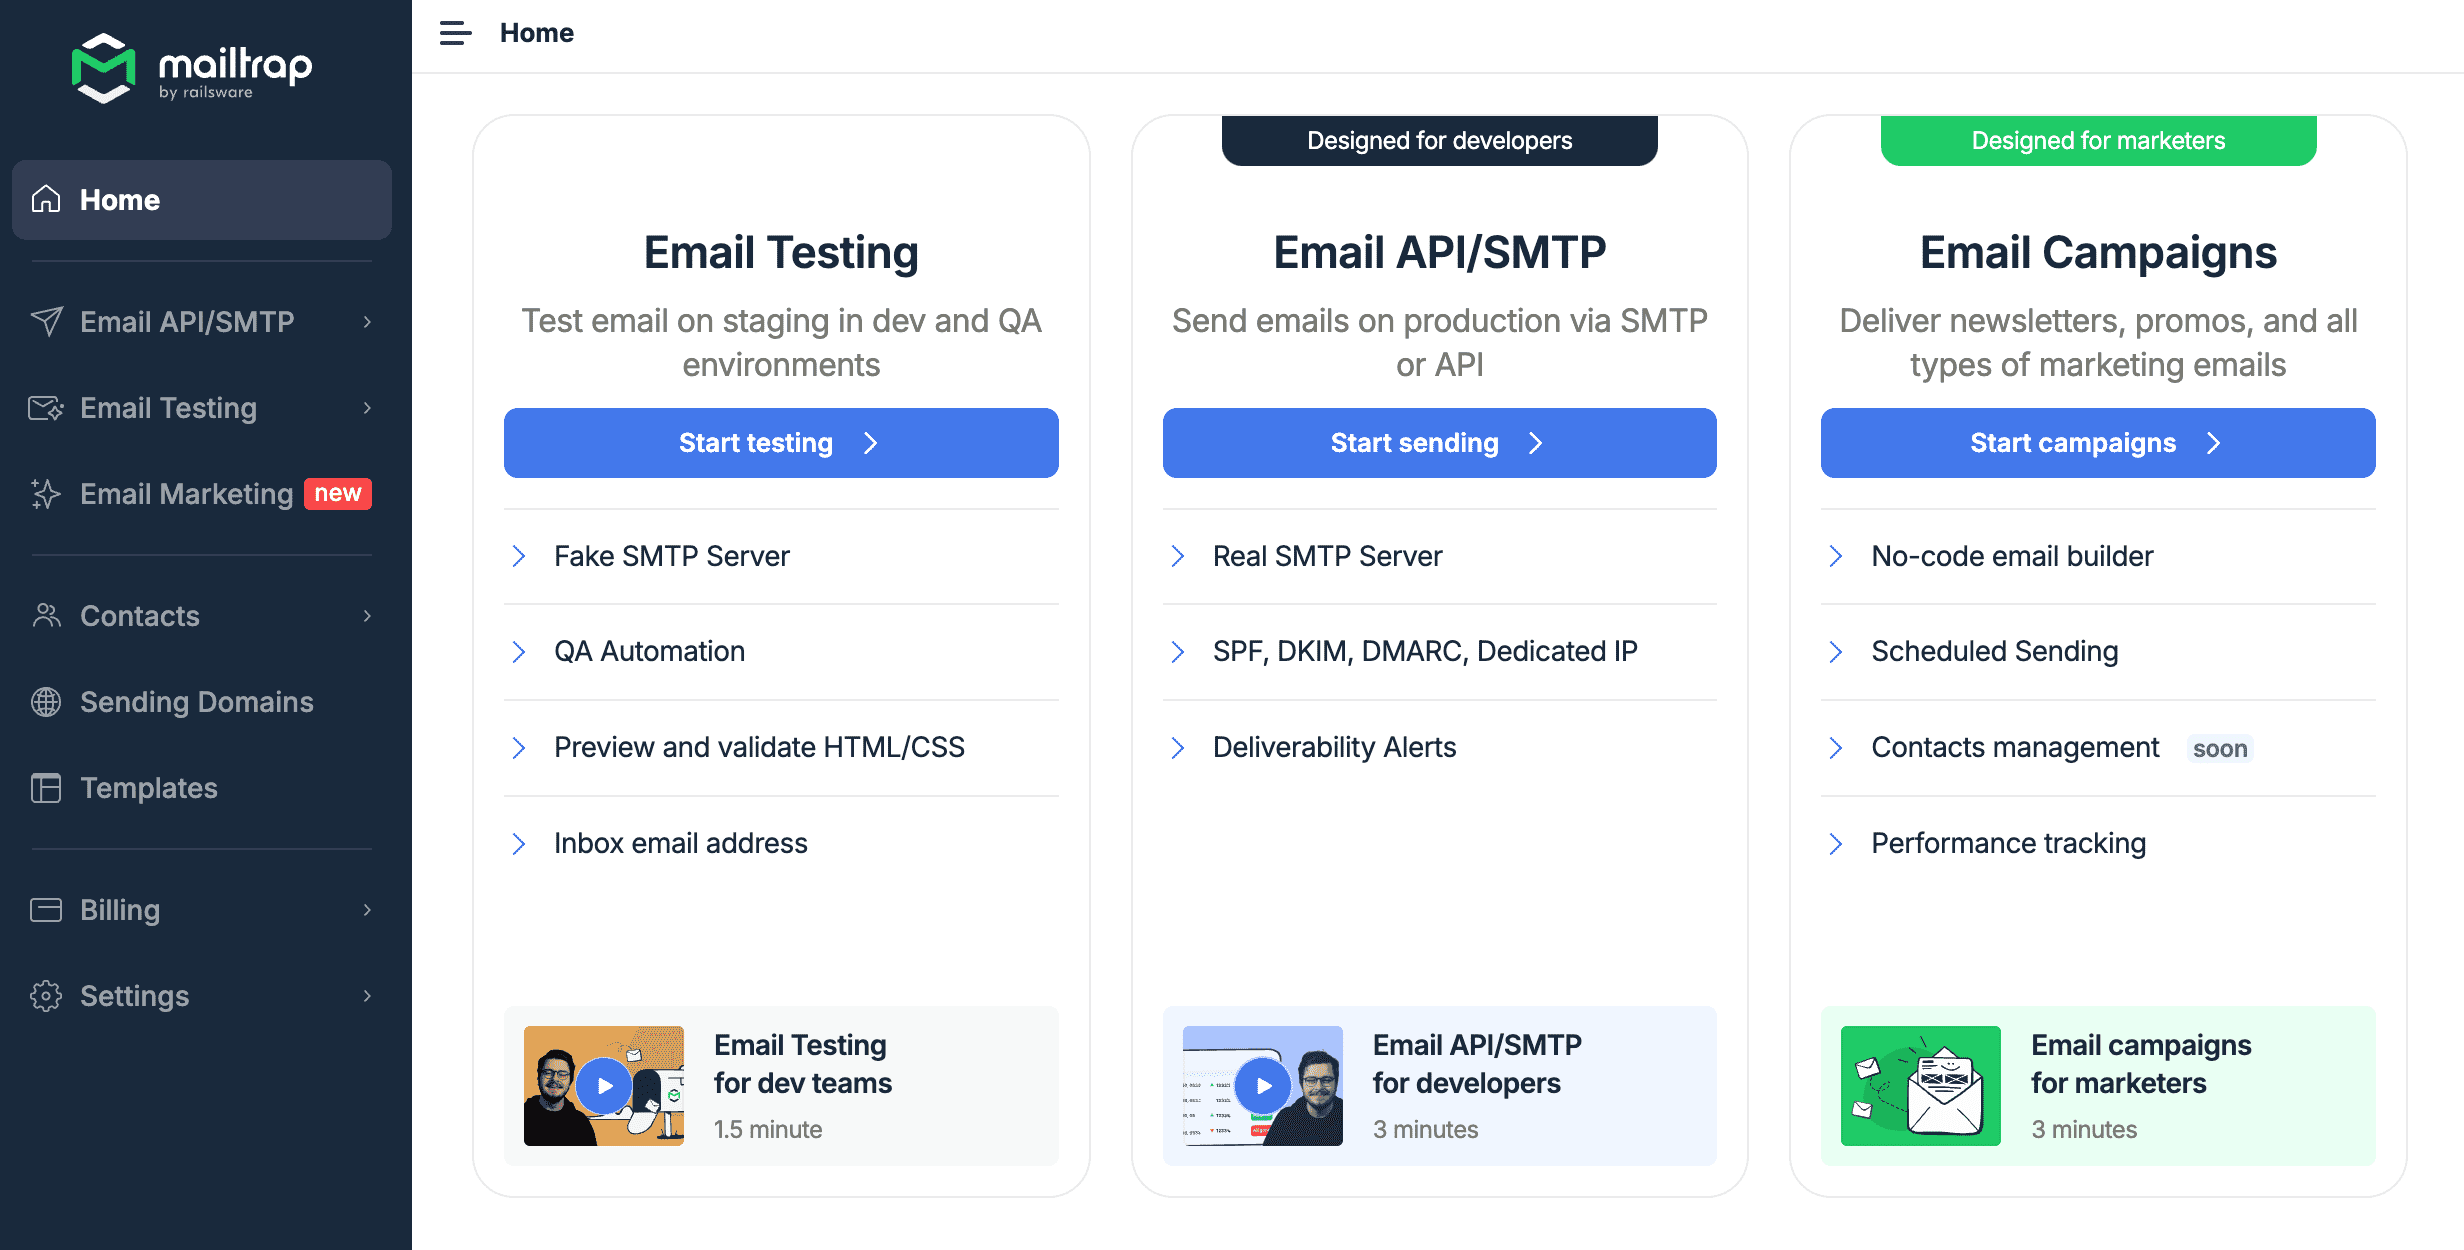
Select "Email API/SMTP":
-
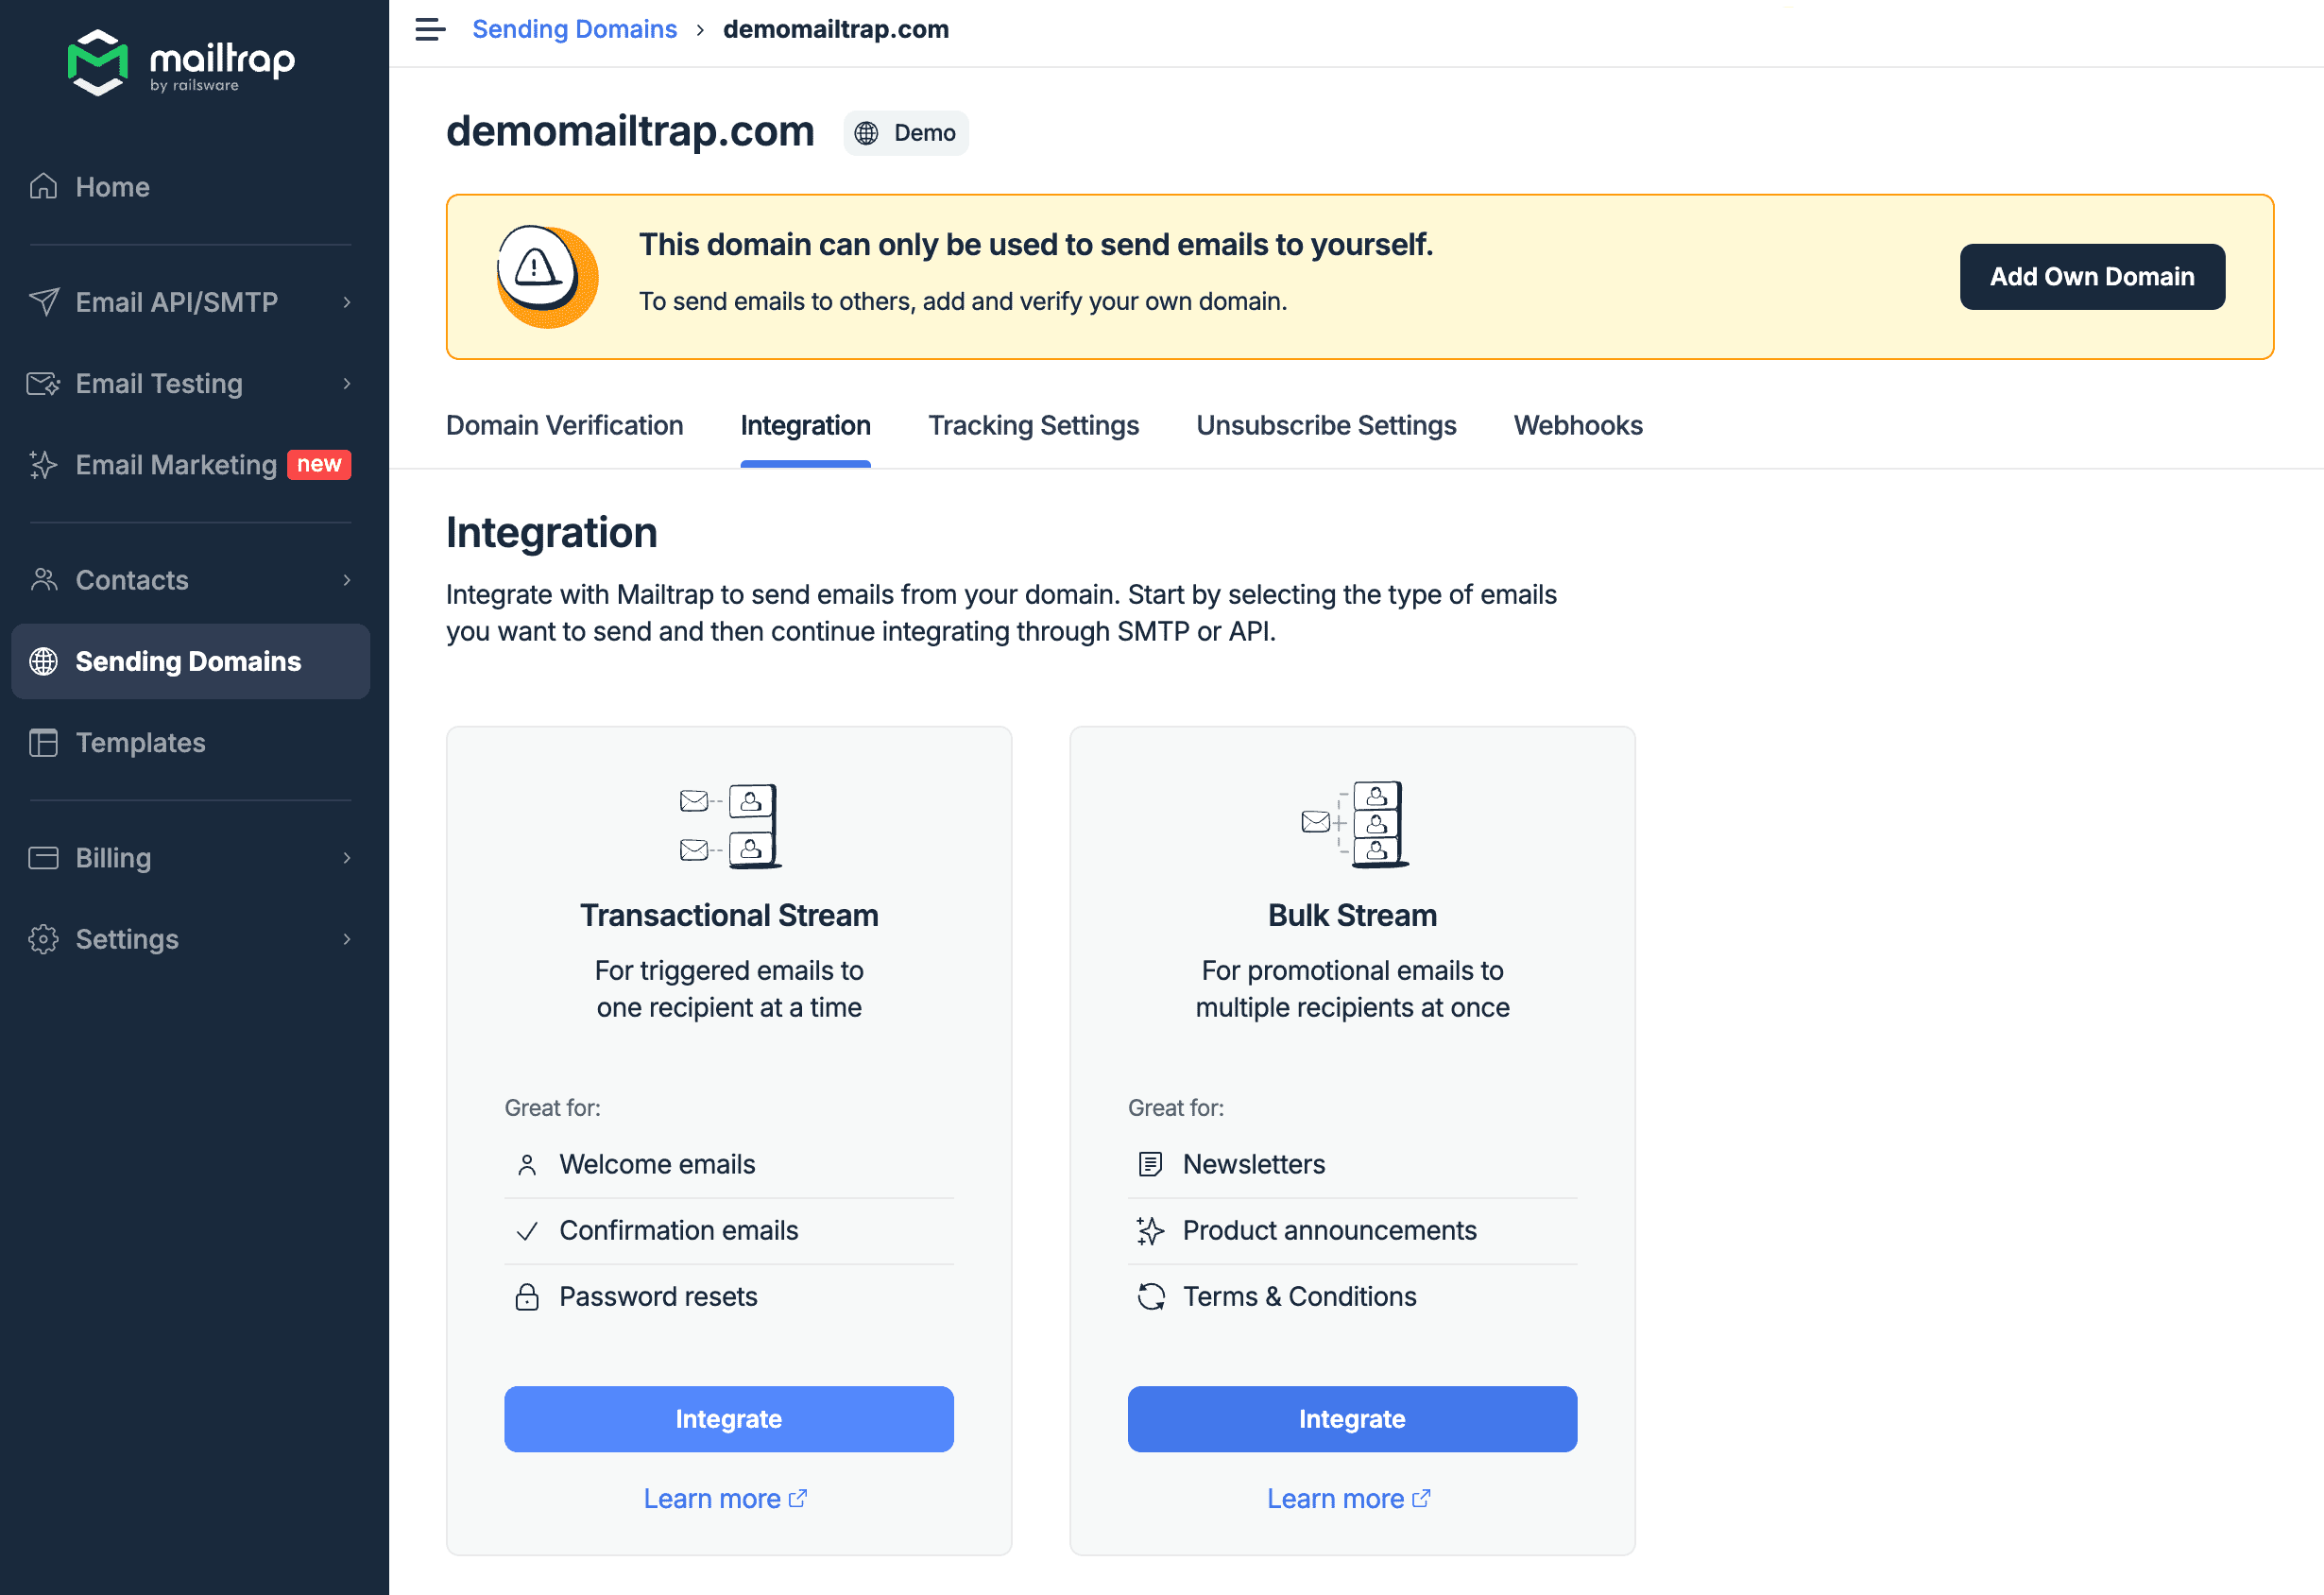
Select "Demo Domain":

-
Select "Transactional Stream":
-
Make a note of the username, in this case
api, and the password, in this case ending89c1: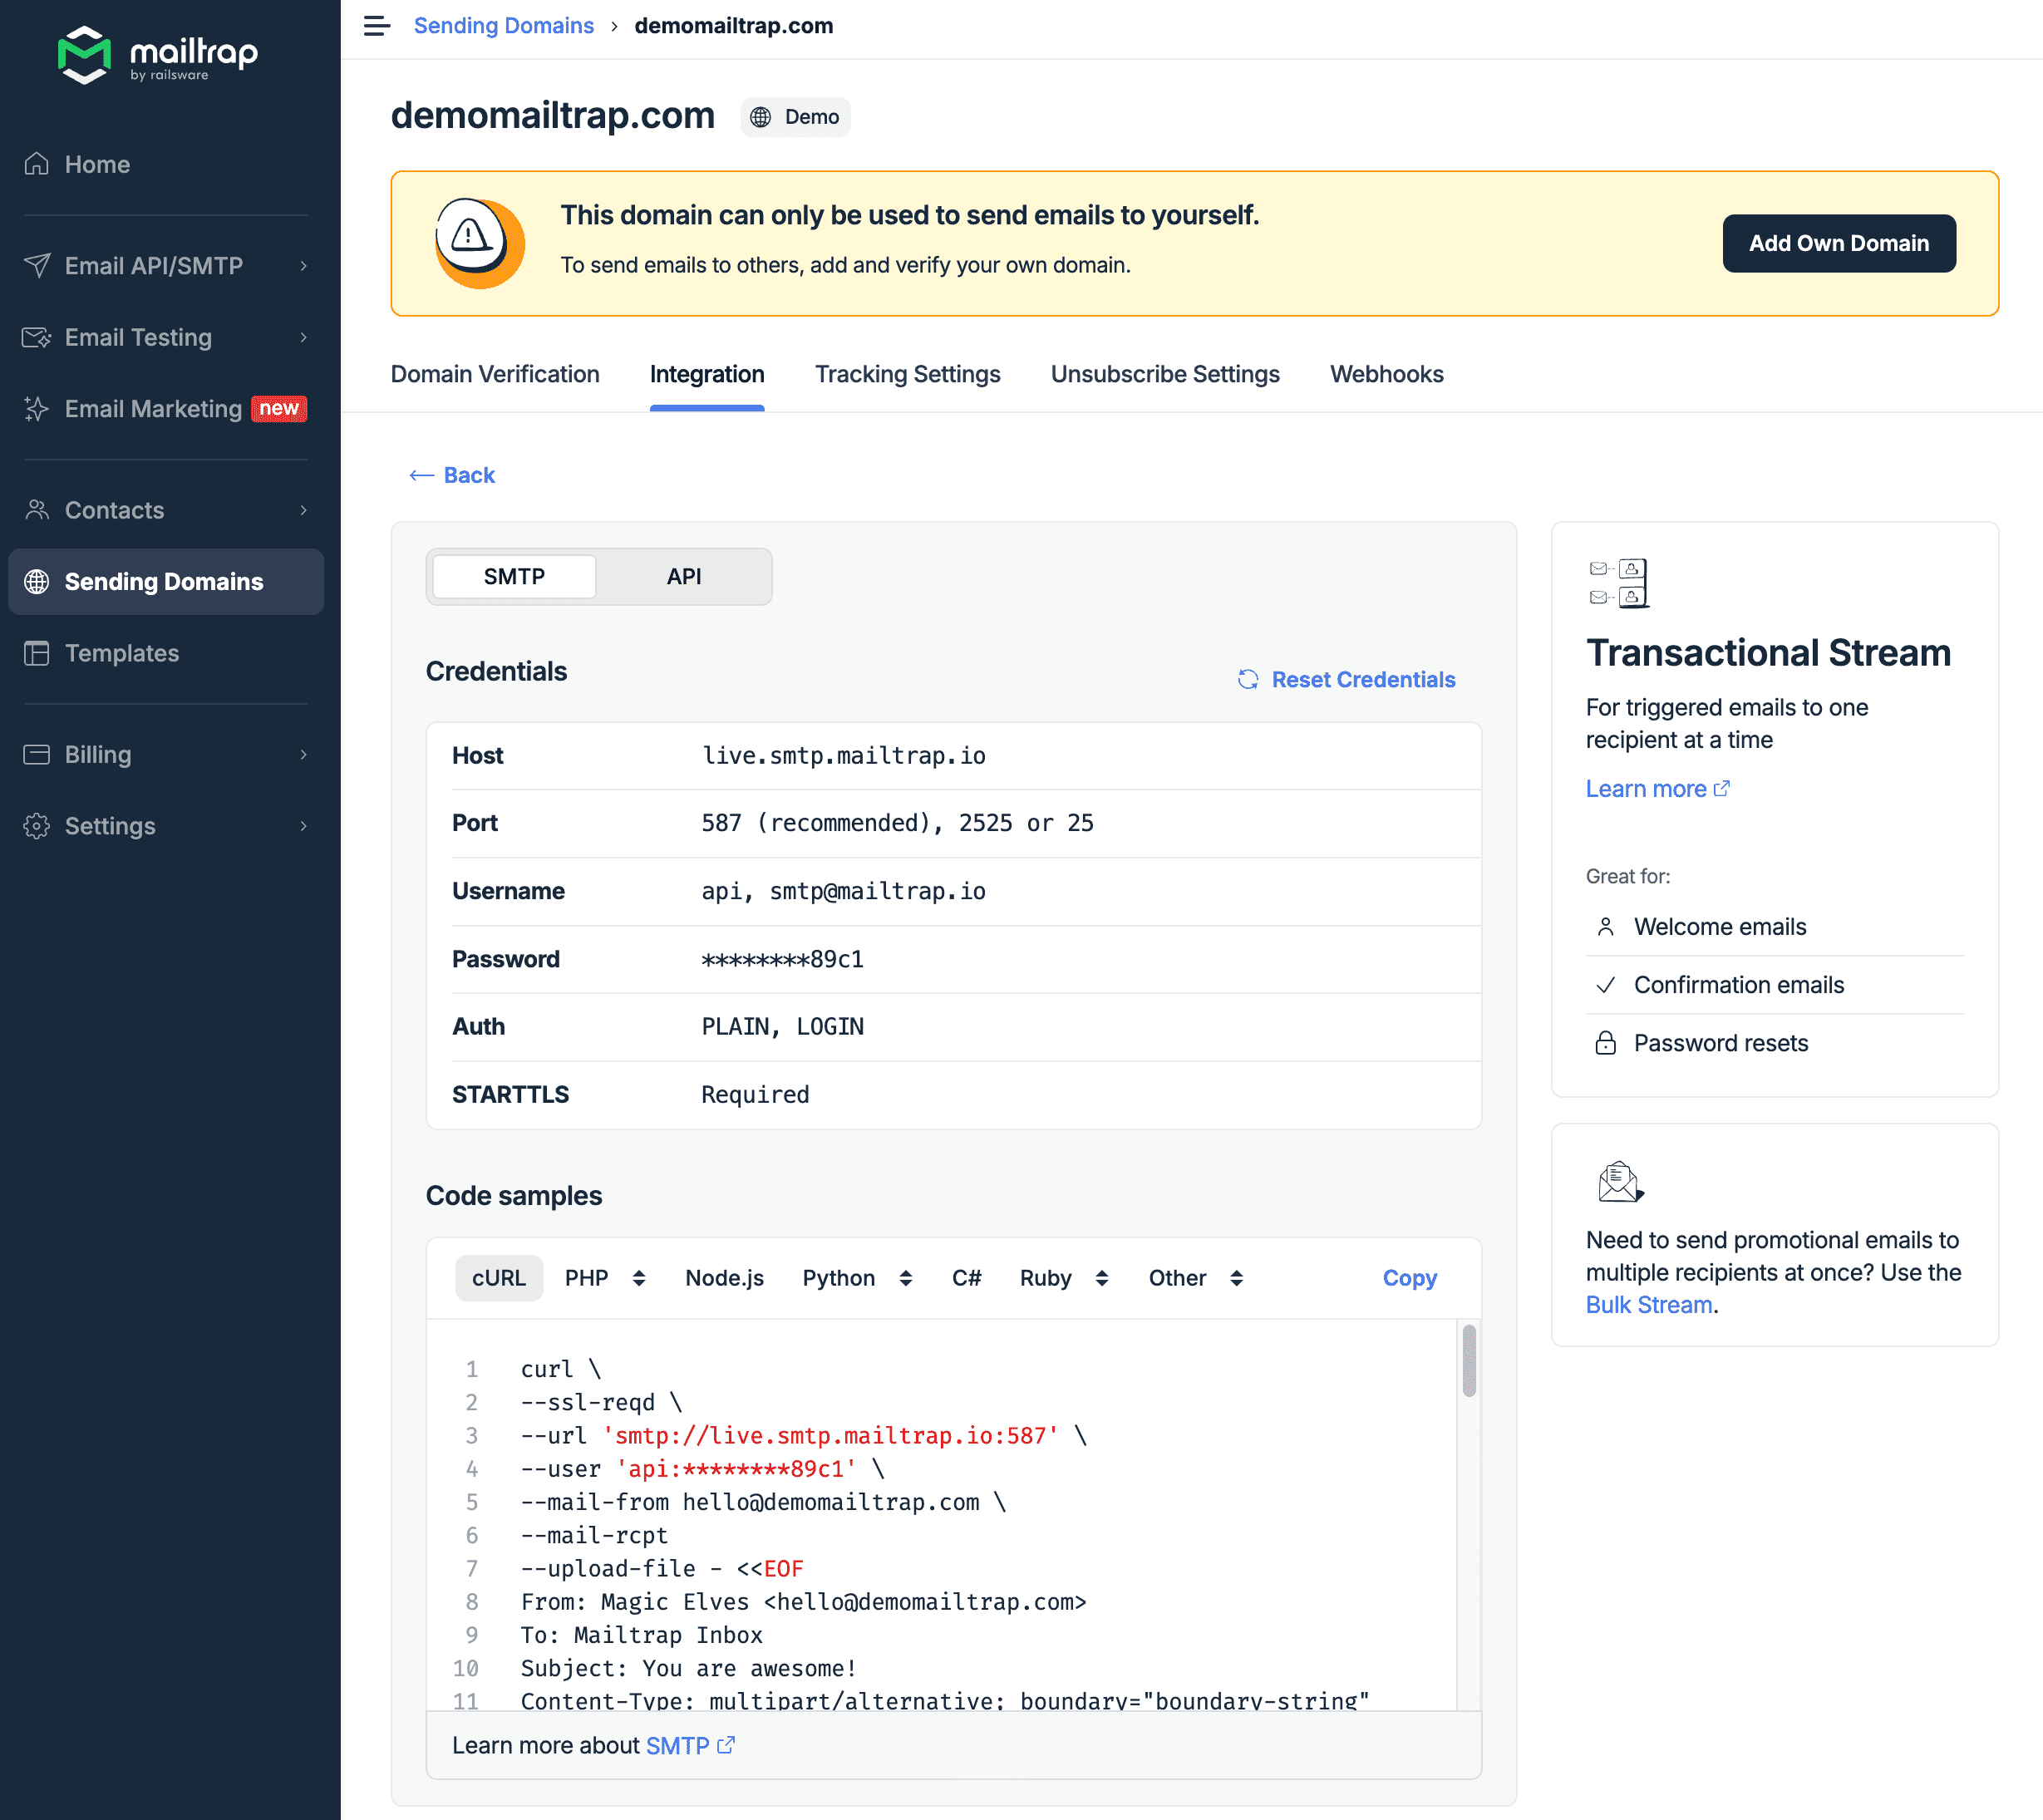
Create a Sealed Secret
We need to get this credential into our cluster. Let’s create a sealed secret:
kubectl -n observability create secret generic grafana-smtp-creds \
  --from-literal=username='changeme' \
  --from-literal=password='changeme' \
  --dry-run=client -o yaml \
  > grafana-smtp-creds.yaml

kubeseal --format=yaml --cert=pub-sealed-secrets.pem \
  < grafana-smtp-creds.yaml > grafana-smtp-creds-sealed.yaml

rm grafana-smtp-creds.yaml
Copy grafana-smtp-creds-sealed.yaml to the infrastructure/observability directory, and update the kustomization.yaml to include it:
apiVersion: kustomize.config.k8s.io/v1beta1
kind: Kustomization
resources:
  - namespace.yaml
  - grafana-adminuser-creds-sealed.yaml
  - grafana-smtp-creds-sealed.yaml (1)
  - kube-prometheus-stack.yaml
  - loki-stack.yaml
Configure Grafana SMTP
Edit infrastructure/observability/kube-prometheus-stack.yaml and add the SMTP configuration to the Grafana values:
apiVersion: helm.toolkit.fluxcd.io/v2
kind: HelmRelease
metadata:
  name: kube-prometheus-stack
  namespace: observability
spec:
  # ...
  values:
    # ...
    grafana:
      # ...
      smtp:
        enabled: true
        existingSecret: grafana-smtp-creds
        userKey: username
        passwordKey: password
      grafana.ini:
        smtp:
          enabled: true
          host: live.smtp.mailtrap.io:587
          from_address: mailtrap@demomailtrap.com
  # ...
Create Contact Points
We need to tell Grafana where to send the alerts. Create the following file, grafana-contact-points.yaml:
apiVersion: 1
contactPoints:
  - orgId: 1
    name: grafana-default-email
    receivers:
      - uid: a
        type: email
        settings:
          addresses: changeme (1)
          singleEmail: false
disableResolveMessage: false| 1 | This email address needs to match the email address you signed up with on Mailtrap. |
We don’t want to commit this file to source control, because then our email address would be exposed. If you remember from the previous post where we set up the kube-prometheus-stack, we enabled a feature to scan the cluster for resources matching certain labels. We are going to use this feature by creating a sealed secret out of our contact points, where the secret contains these labels.
cat <<EOF > grafana-contact-points-secret.yaml
apiVersion: v1
kind: Secret
metadata:
  name: grafana-contact-points
  namespace: observability
  labels:
    grafana_alert: "1" (1)
data:
  contact-points.yaml: |
    $(cat grafana-contact-points.yaml | base64 -w 0)
EOF| 1 | This label is needed for Grafana to recognise the resource. |
The result should be something like:
apiVersion: v1
kind: Secret
metadata:
  name: grafana-contact-points
  namespace: observability
  labels:
    grafana_alert: "1"
data:
  contact-points.yaml: |
    YXBpVmVyc2lvbjogMQpjb250YWN0UG9pbnRzOgogIC0gb3JnSWQ6IDEKICAgIG5hbWU6IGdyYWZhbmEtZGVmYXVsdC1lbWFpbAogICAgcmVjZWl2ZXJzOgogICAgICAtIHVpZDogYQogICAgICAgIHR5cGU6IGVtYWlsCiAgICAgICAgc2V0dGluZ3M6CiAgICAgICAgICBhZGRyZXNzZXM6IGNoYW5nZW1lIDwxPgogICAgICAgICAgc2luZ2xlRW1haWw6IGZhbHNlCiAgICAgICAgZGlzYWJsZVJlc29sdmVNZXNzYWdlOiBmYWxzZQo=
Seal the secret:
kubeseal --format=yaml --cert=pub-sealed-secrets.pem \
  < grafana-contact-points-secret.yaml > grafana-contact-points-sealed.yaml
Copy grafana-contact-points-sealed.yaml to the infrastructure/observability directory, and update the kustomization.yaml to include it:
apiVersion: kustomize.config.k8s.io/v1beta1
kind: Kustomization
resources:
  - namespace.yaml
  - grafana-adminuser-creds-sealed.yaml
  - grafana-contact-points-sealed.yaml (1)
  - grafana-smtp-creds-sealed.yaml
  - kube-prometheus-stack.yaml
  - loki-stack.yaml
Create Alerts
Download this YAML file as grafana-custom-alert-rules.yaml, and move it to the infrastructure/observability directory.
|
If you are using a VM instead of a home server, you may not have metrics for device temperature. If this is the case, remove the entry from the YAML file. |
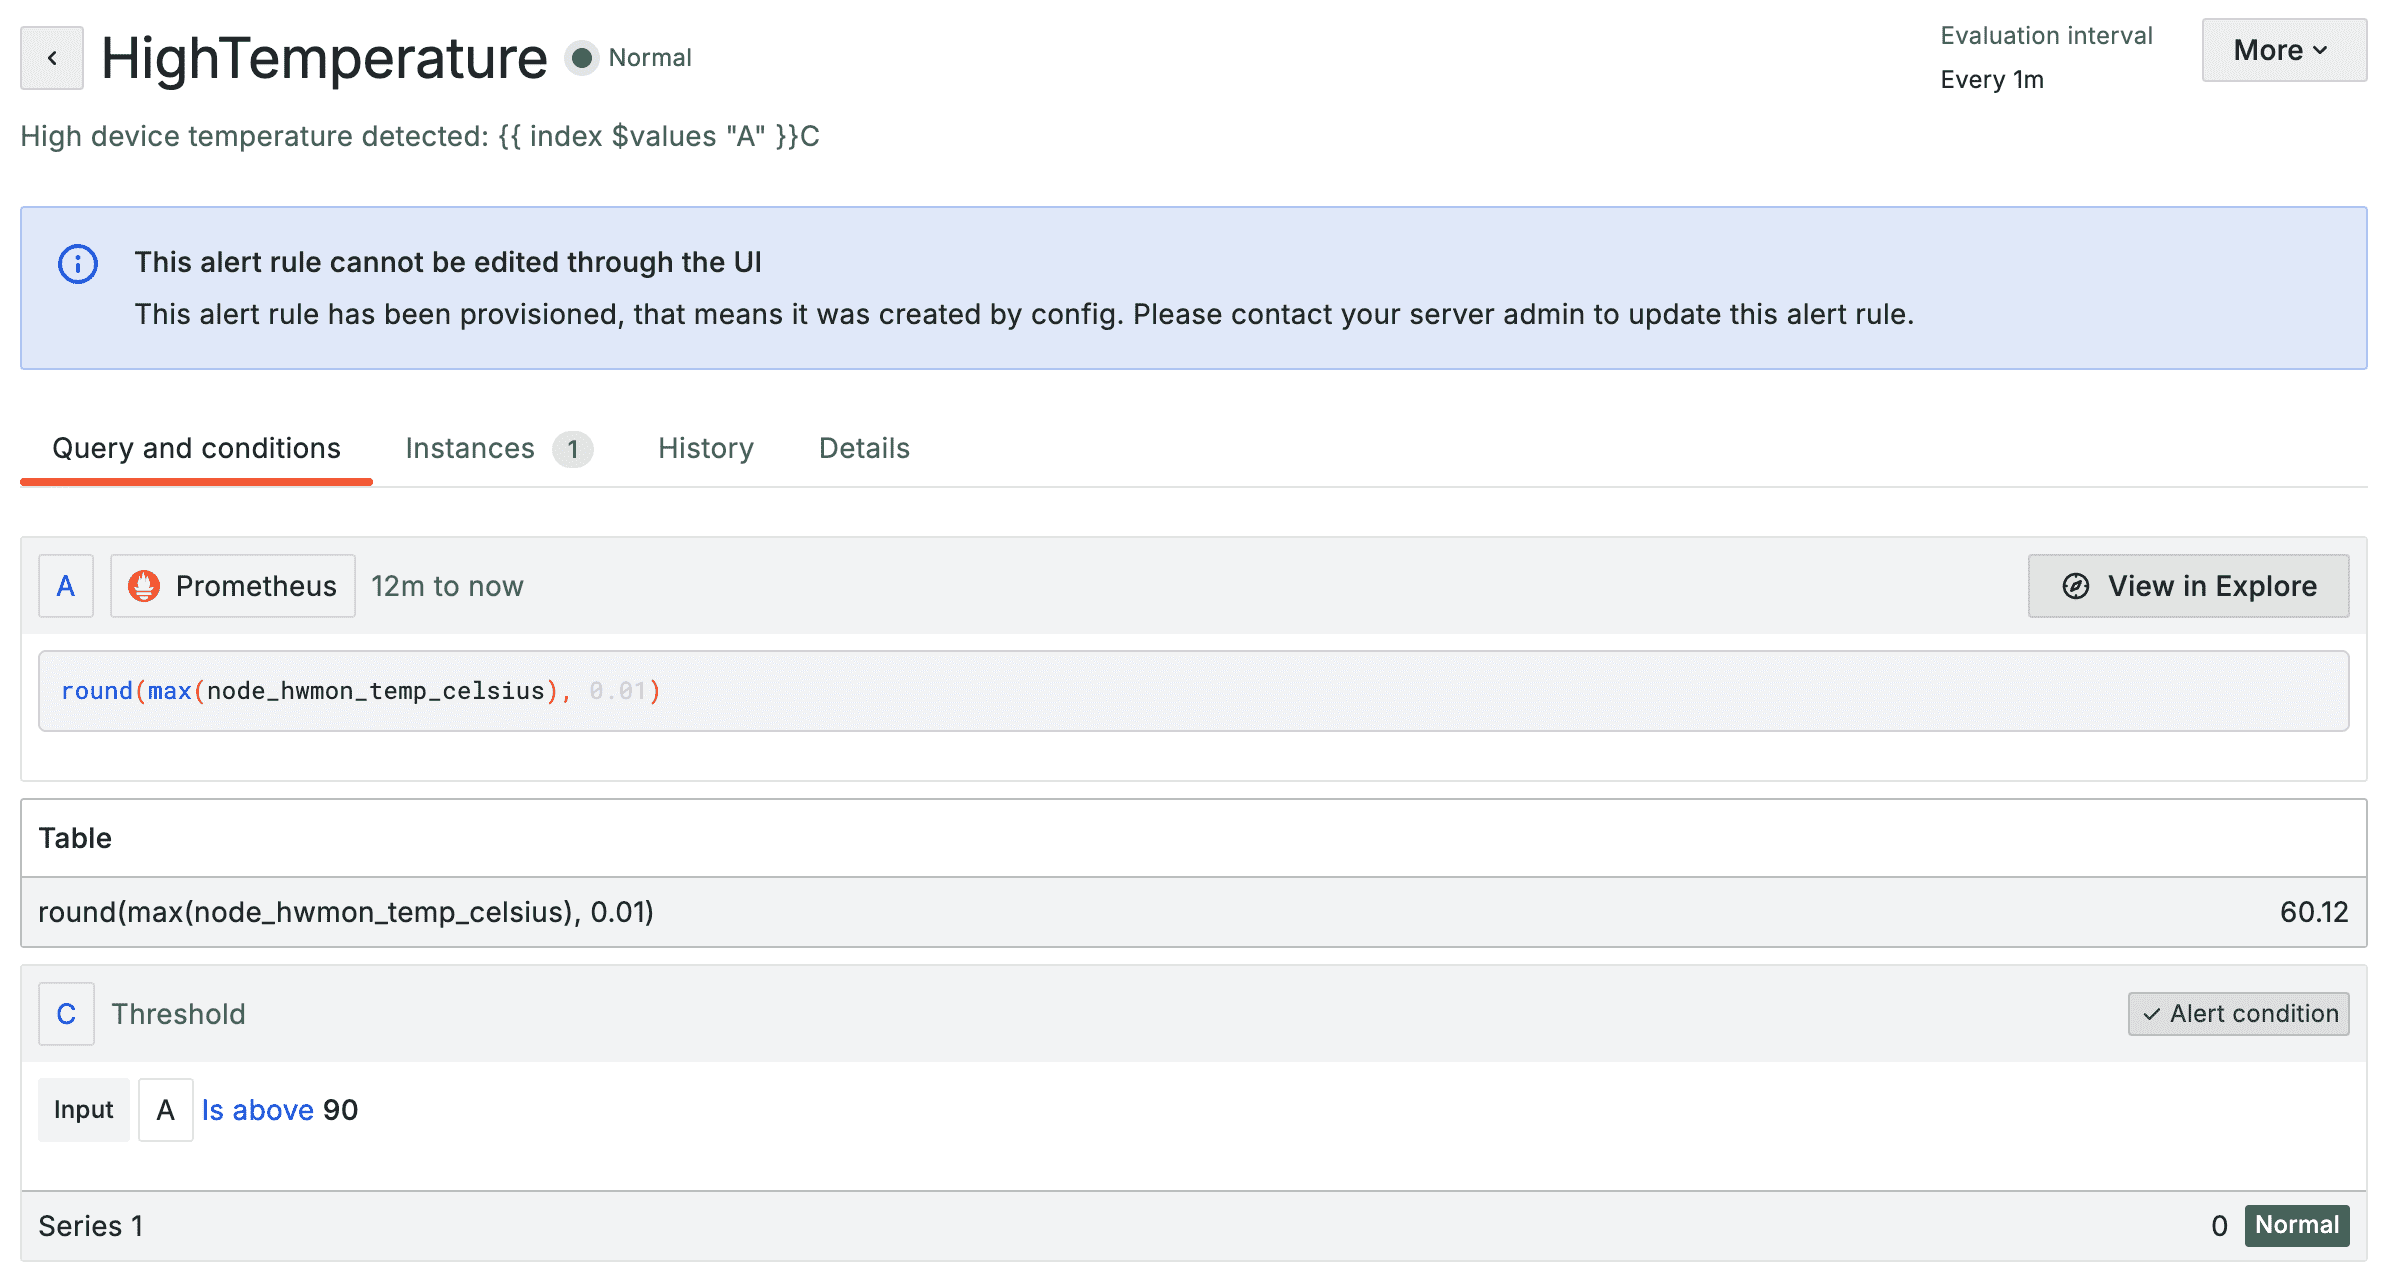
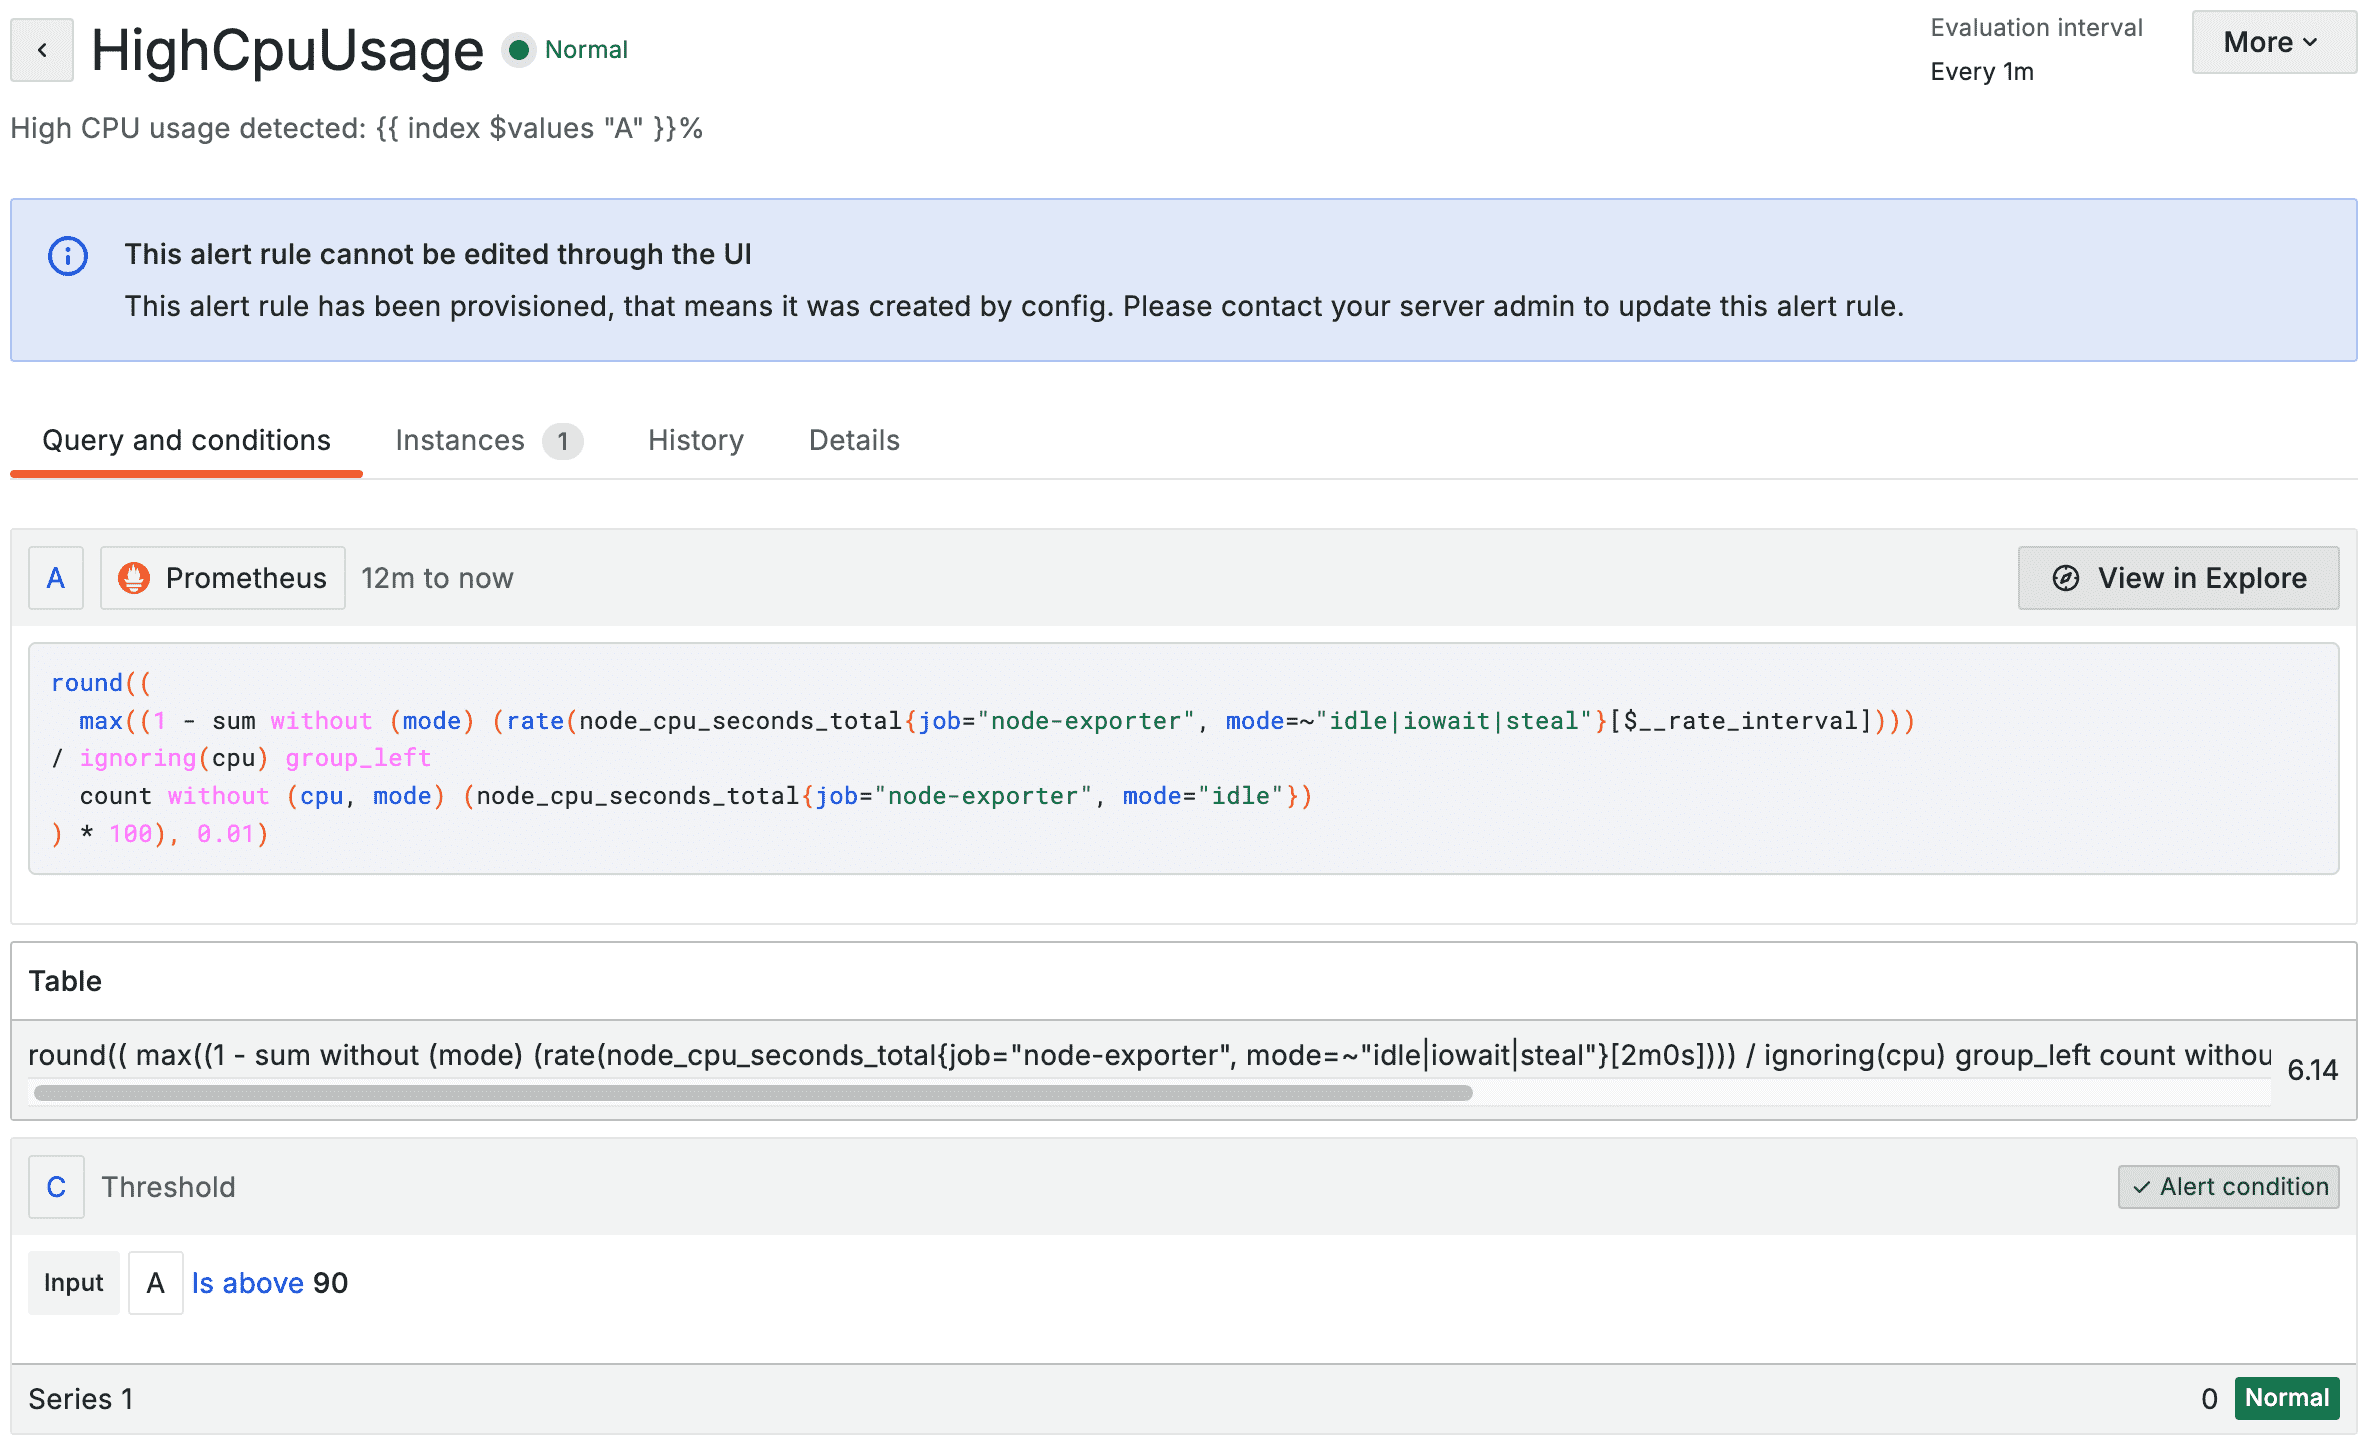
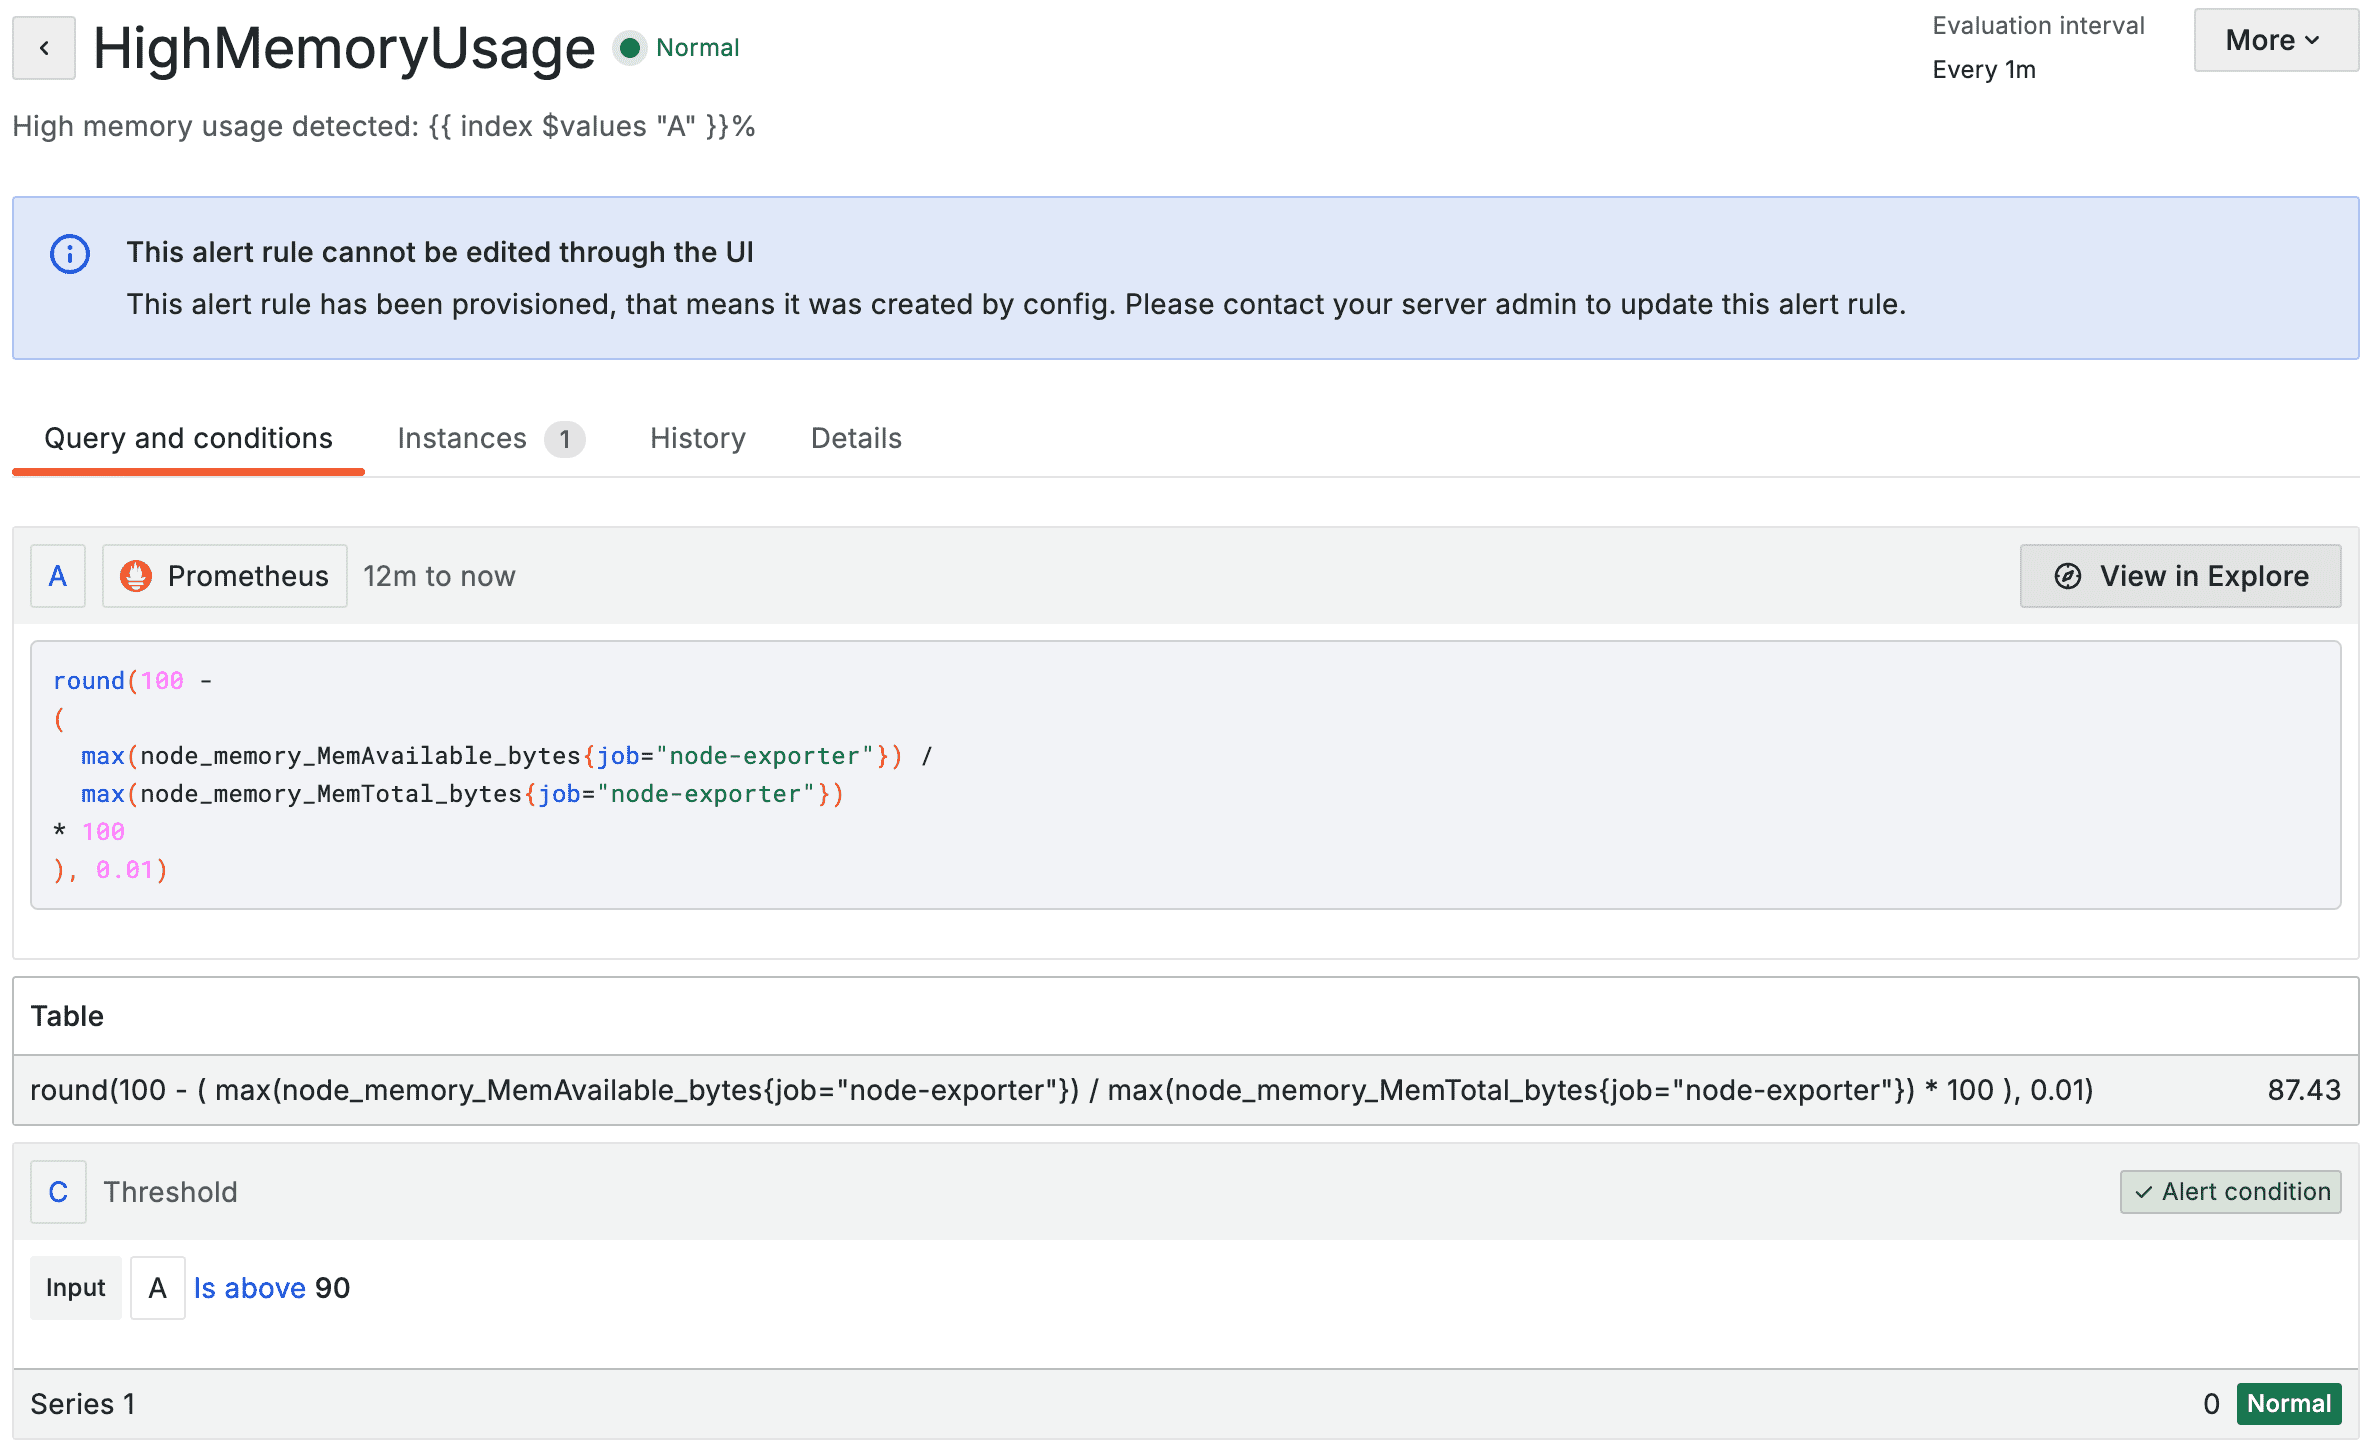
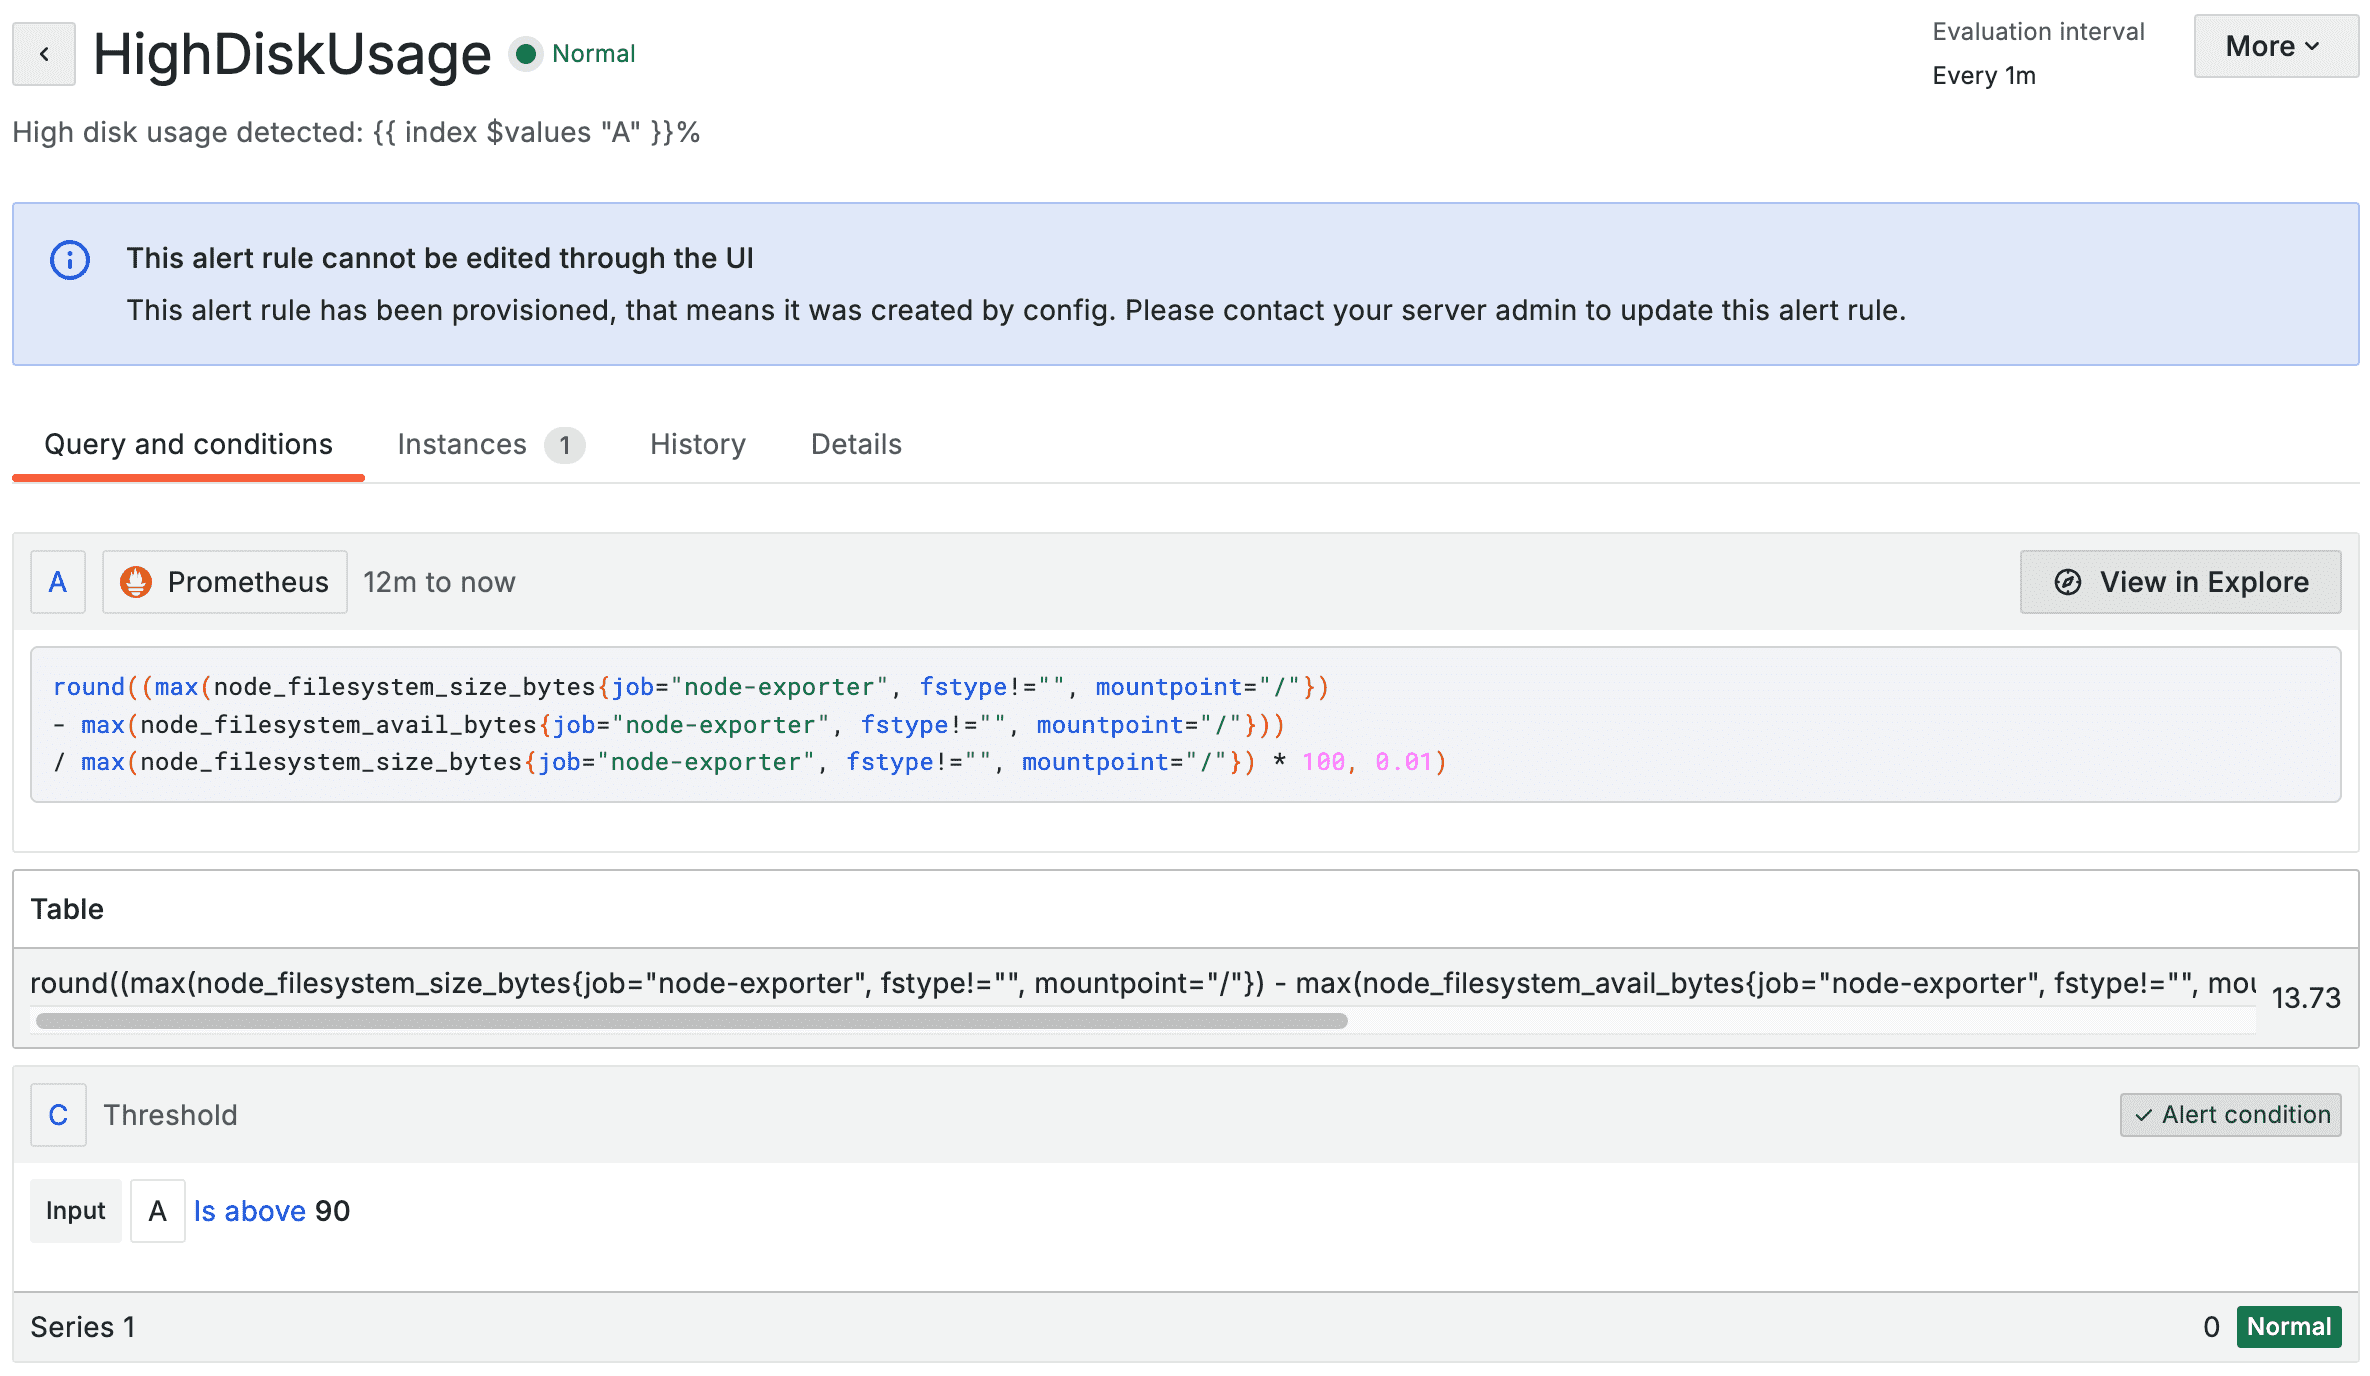
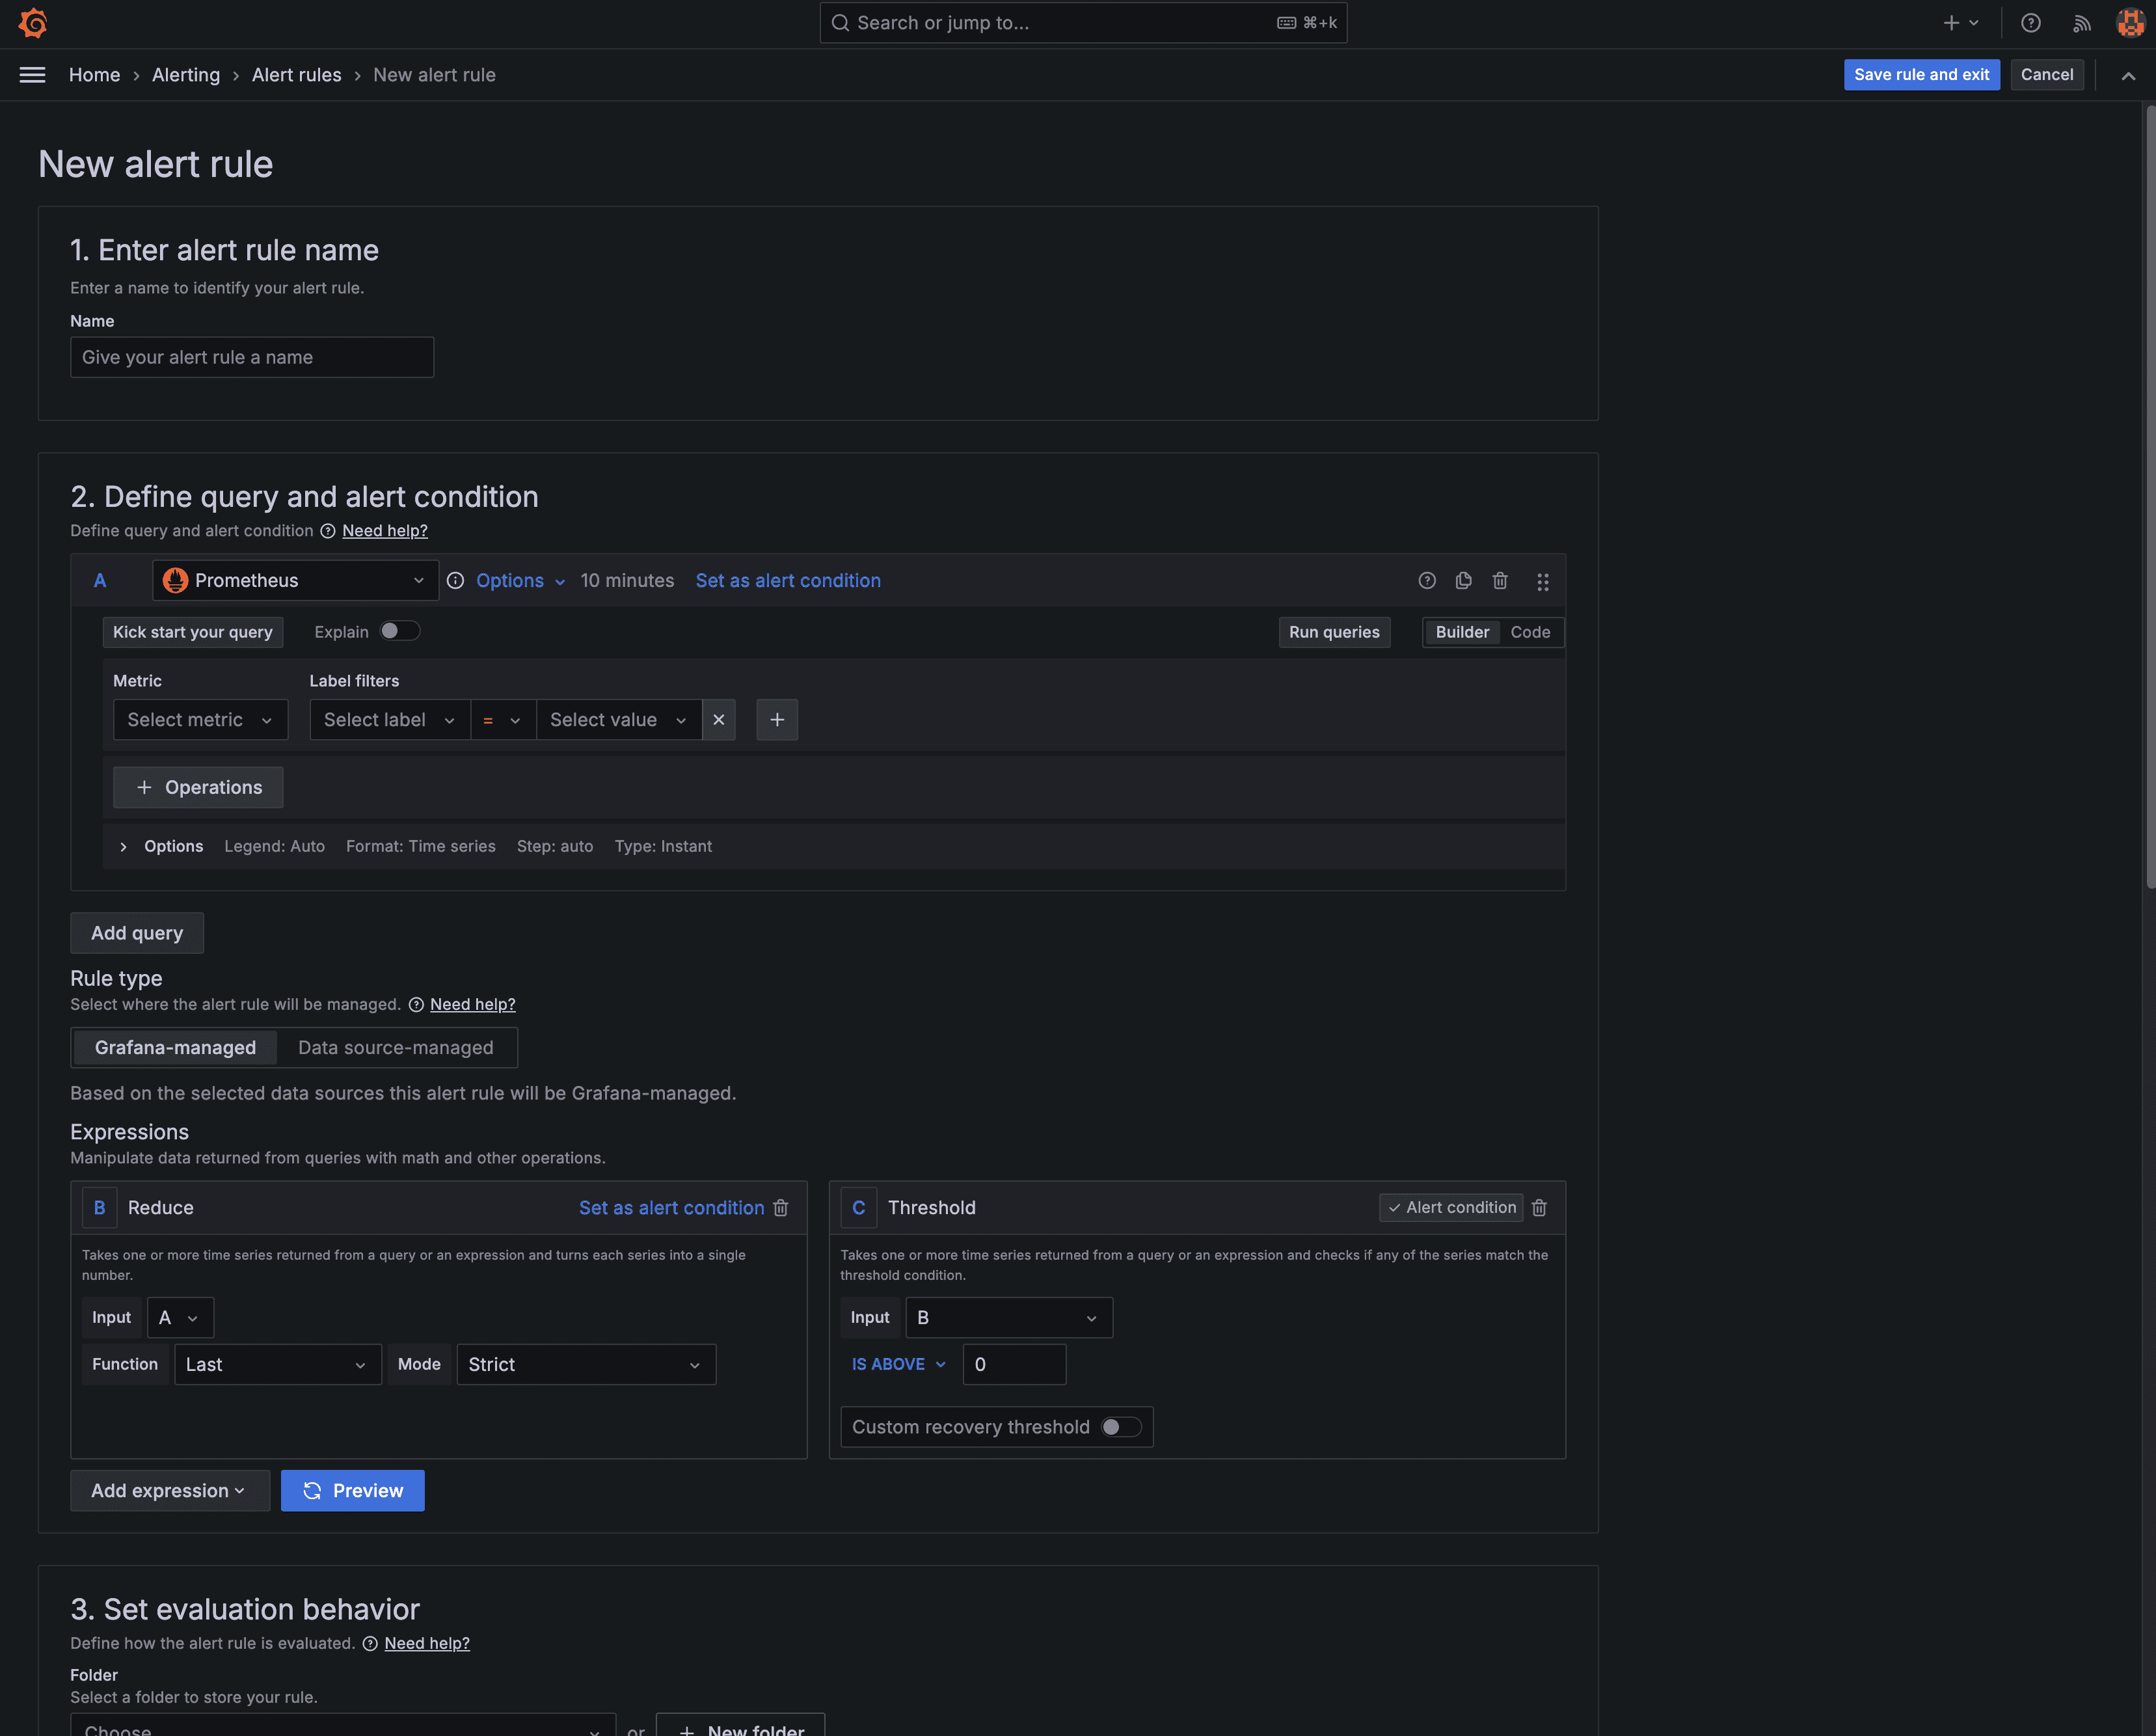
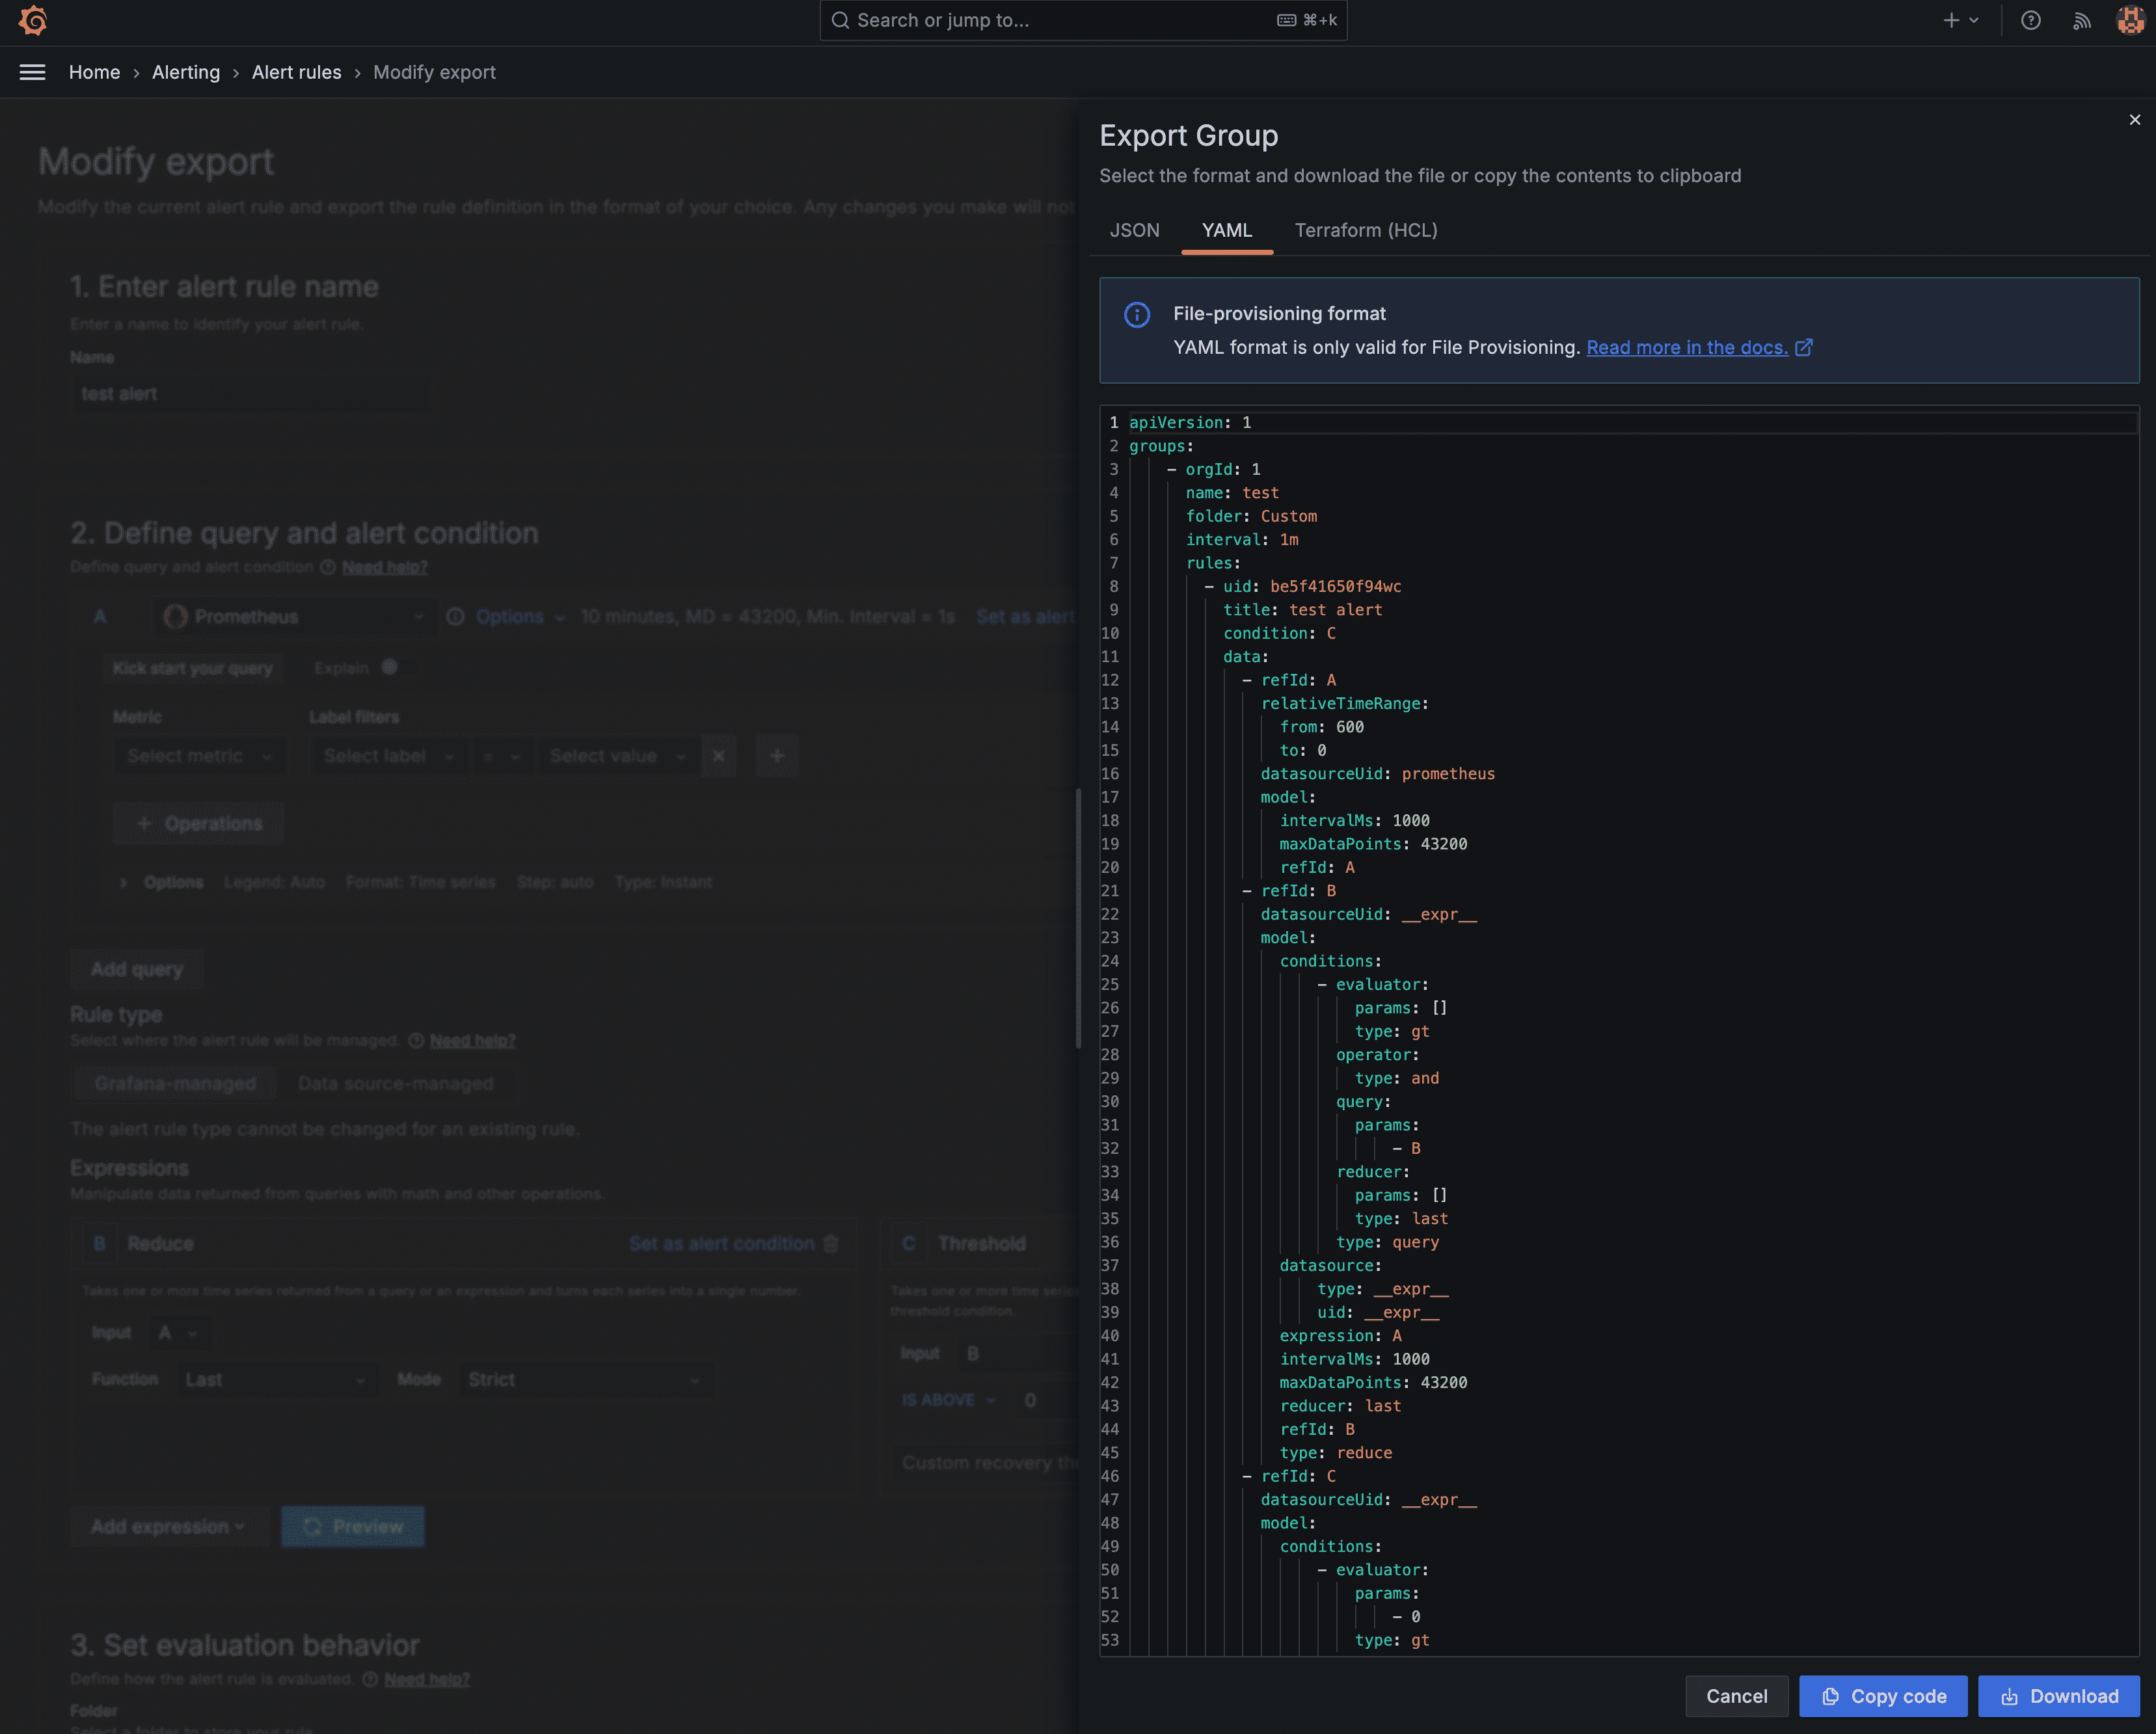
We won’t go into the YAML line by line because it’s quite long. The file was generated by first manually configuring the alerts in Grafana, and then exporting them to YAML (we’ll show you how to do this in the adding more alerts section).
This is what the alerts look like when they’re imported into Grafana:
Add the following to the kustomization.yaml:
apiVersion: kustomize.config.k8s.io/v1beta1
kind: Kustomization
configMapGenerator: (1)
  - name: grafana-alerts
    namespace: observability
    files:
      - grafana-custom-alert-rules.yaml
    options:
      labels:
        grafana_alert: "1" (2)
resources:
  - namespace.yaml
  - grafana-adminuser-creds-sealed.yaml
  - grafana-contact-points-sealed.yaml
  - grafana-smtp-creds-sealed.yaml
  - kube-prometheus-stack.yaml
- loki-stack.yaml| 1 | We’re using a Kustomize feature here. We can provide a list of files and have config maps generated for them. |
| 2 | Grafana will discover and process these config maps by this label. |
Apply the Flux Resources
The resultant Flux bootstrap project should look like this:
.
├── clusters
│   └── production
│       ├── flux-system
│       │   ├── gotk-components.yaml
│       │   ├── gotk-sync.yaml
│       │   └── kustomization.yaml
│       └── infrastructure.yaml
└── infrastructure
    ├── controllers
    │   ├── kustomization.yaml
    │   └── sealed-secrets.yaml
    └── observability
        ├── grafana-adminuser-creds-sealed.yaml
        ├── grafana-contact-points-sealed.yaml
        ├── grafana-custom-alert-rules.yaml
        ├── grafana-smtp-creds-sealed.yaml
        ├── kube-prometheus-stack.yaml
        ├── kustomization.yaml
        ├── loki-stack.yaml
        └── namespace.yaml

7 directories, 14 files
Git commit and push. Flux will soon reconcile the changes:
NAME REVISION SUSPENDED READY MESSAGE
kustomization/flux-system main@sha1:2826b185 False True Applied revision: main@sha1:2826b185
kustomization/infra-controllers main@sha1:2826b185 False True Applied revision: main@sha1:2826b185
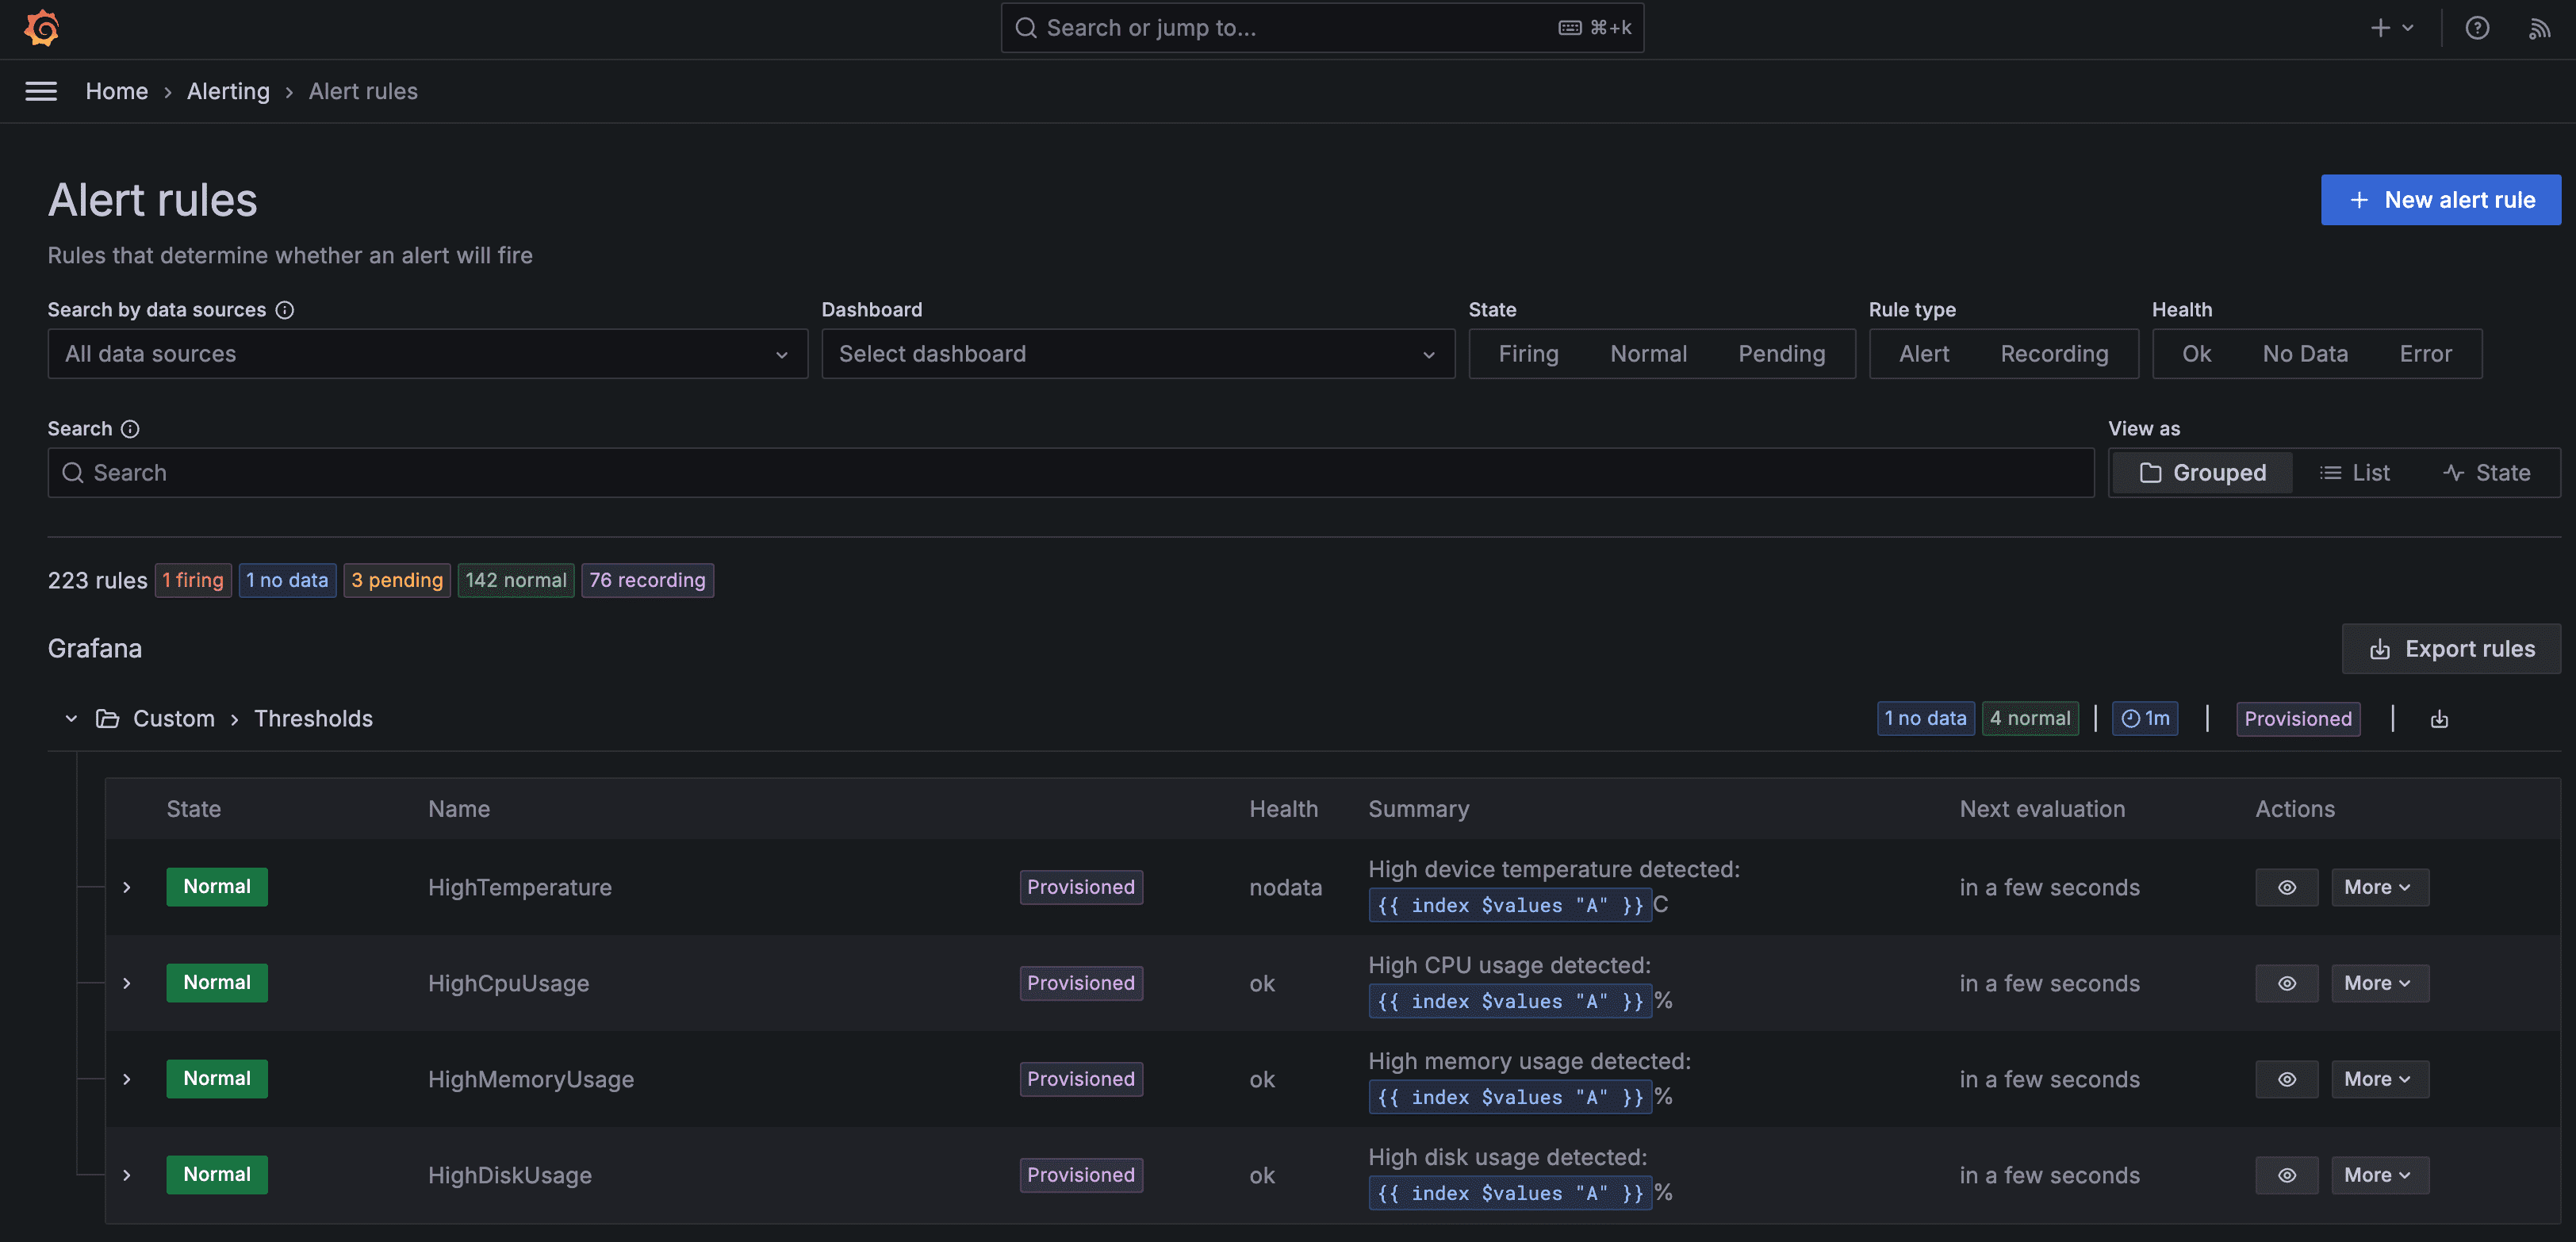
kustomization/infra-observability main@sha1:2826b185 False True Applied revision: main@sha1:2826b185Login to Grafana, click "Alerting" and "Alert rules", and you should see the alerts, with a special "Provisioned" state:
Navigate to "Alerting" and "Contact Points", and you should see the contact point you provided:
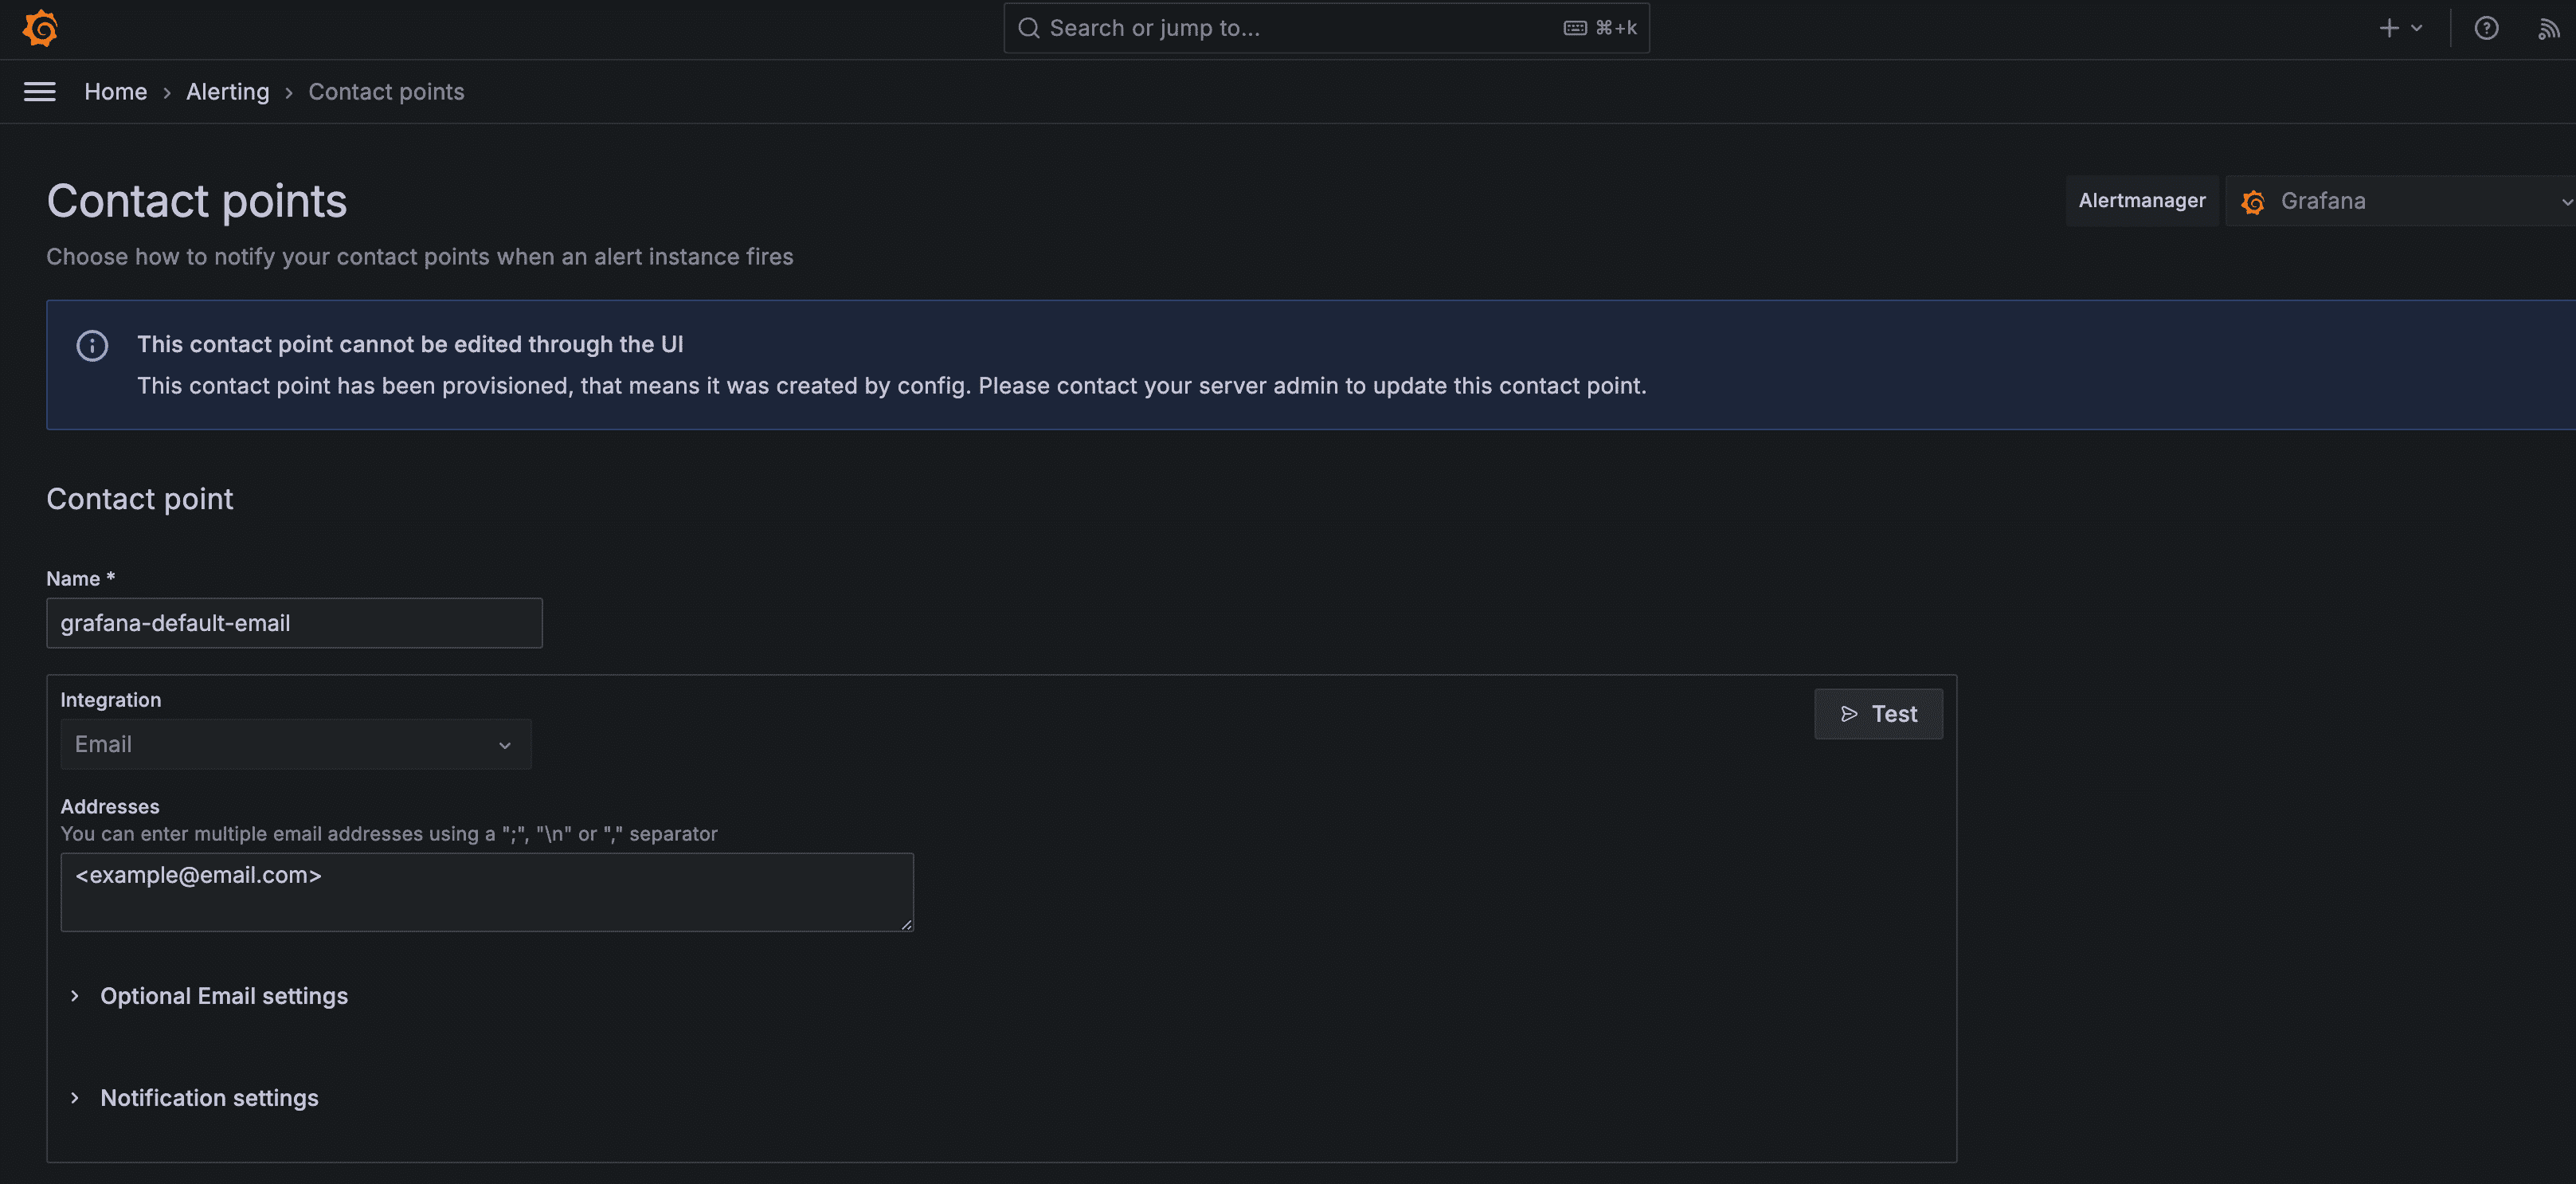
Click "Test" to verify SMTP has been correctly configured:
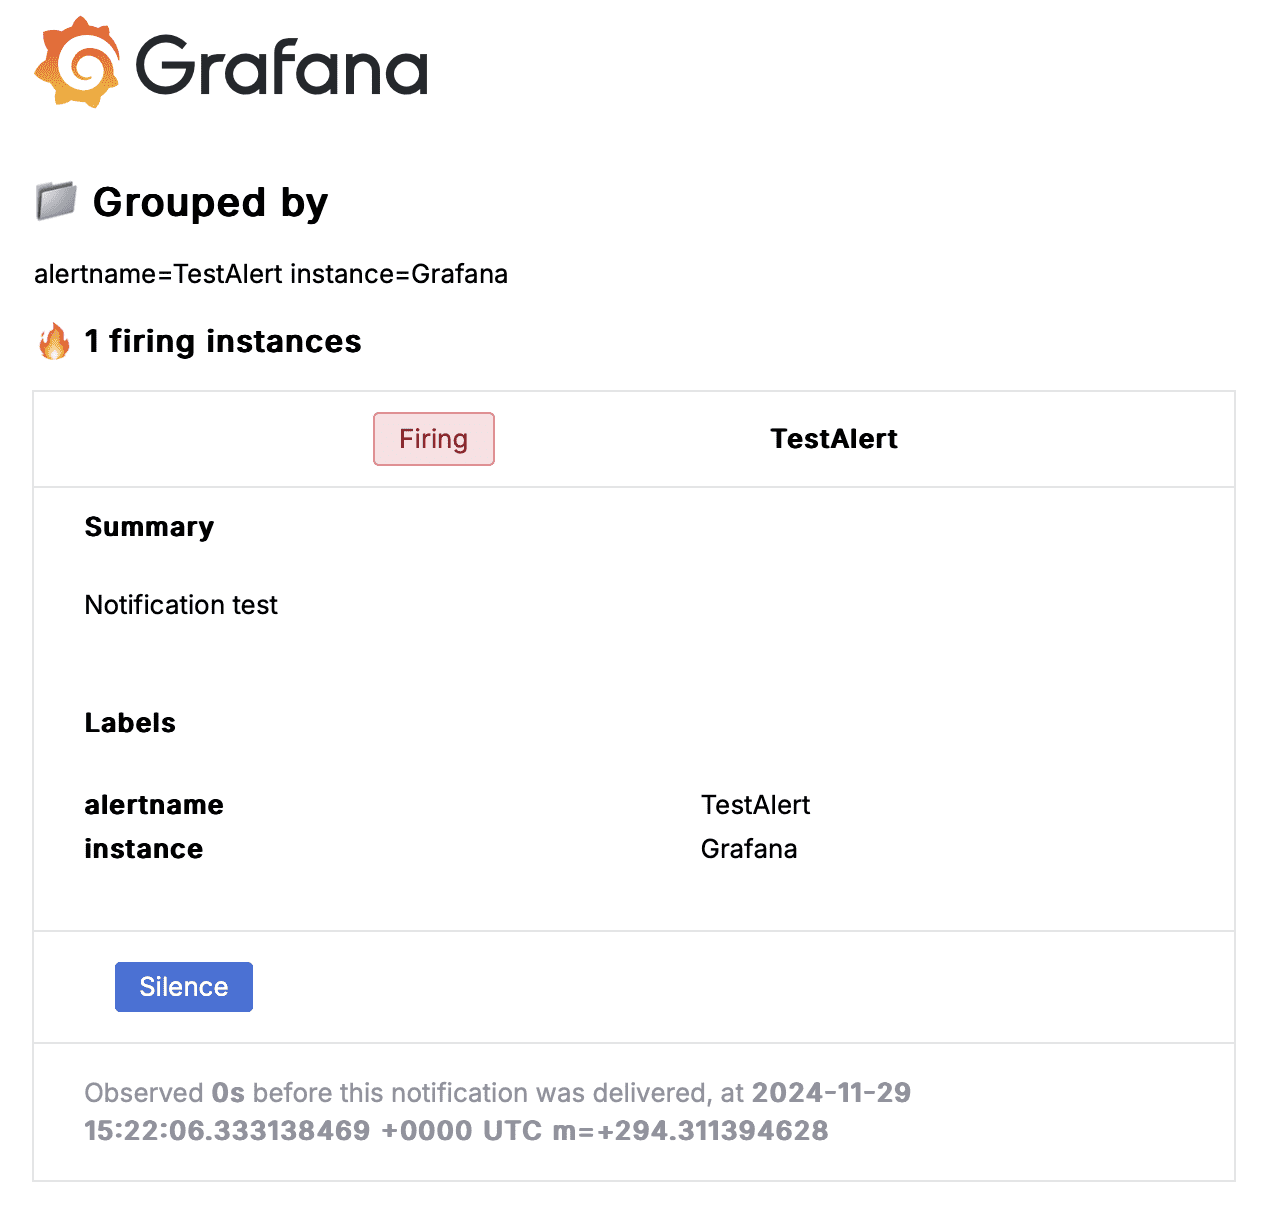
That’s it! You’ll now be notified by email if there’s an issue with your server. Grafana will send a follow-up email once the issue is resolved.
Adding More Alerts
There’s probably more you want to be alerted about. Perhaps some application metrics. I’d recommend creating the alert via the Grafana UI, and then exporting it to YAML when you’re happy with it, as working with the YAML itself can be a bit cumbersome.
Once you have the YAML, add it to your grafana-custom-alert-rules.yaml, and commit and push.
Deleting Alerts
Removing an alert from the grafana-custom-alert-rules.yaml file will not delete the alert from Grafana. Instead you’ll need to define a list of deleteRules, and apply them in the same was we applied grafana-custom-alert-rules.yaml. For example, to delete the high temperature alert we previously created:
apiVersion: 1
deleteRules:
  - orgId: 1
    uid: fdv0br168nvnkc
Add the new YAML file to the kustomization.yaml like we do in this commit.